
Keeping Up with Household Debt in the US
by Francesco Ruggeri, Riccardo Pariboni, and Giuliano Toshiro Yajima
Two crucial questions drive our recently published working paper: (1) how is it possible to have trends in income and consumption inequality as divergent as those observable in the US in the last decades; and (2) what happens when households spend more than their income by borrowing, largely because they want to “keep up” with others? As we will argue, the answers are strictly interwoven.
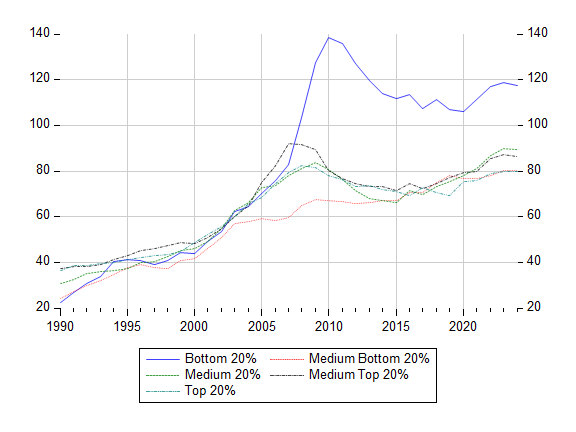
Over the last three decades, the US economy has exhibited a heavily skewed distribution of income and wealth. The bottom 20 percent of households consistently receives only around 5 percent of total disposable income, while the top quintile captures about half of disposable income and an increasing share of total net wealth—currently around 70 percent. Income inequality, measured as the ratio of top-to-bottom quintile disposable income, has steadily risen, as the sum of the top 20 percent households’ incomes has risen over 16 times the sum of incomes earned by the lowest 20 percent. By contrast, the top quintile’s consumption relative to the bottom has remained lower and relatively stable. The bottom 20 percent have historically carried the highest debt-to-income ratios, peaking during the Great Recession at just under 140 percent, while their liabilities have grown faster than those of the other quintiles over the past 20 years, highlighting the critical role of borrowing in sustaining consumption among lower-income households (Figure 1).
Figure 1. Debt to Disposable Income Ratio by Quintile
Earlier research has shown that household spending is strongly influenced by social comparison. Duesenberry’s (1949) classic relative income hypothesis argued that families judge their standard of living against others, not just against their own resources. More recent work has documented “expenditure cascades” (Frank et al. 2014), where higher spending at the top pushes others to spend more; “trickle-down consumption” (Bertrand and Morse 2016), in which local inequality drives lower-income households to spend more when surrounded by wealthier peers; and the link between consumption norms and debt (Christen and Morgan 2005), where borrowing becomes a means to sustain social status.
In order to provide an analytical infrastructure to the intuitions we have briefly mentioned so far, we rely on stock-flow consistent modeling. This methodology allows us to track the behavior of flows (such as income, consumption, and investment) and the dynamics of stocks (such as wealth and debt), ensuring that every flow has a counterpart and that nothing disappears from the system (Nikiforos and Zezza 2018).
Our approach also builds on a broader literature linking demand, debt, and growth (Kapeller and Schütz 2014; Szymborska 2022; Ruggeri 2023; Fierro et al. 2023; Pariboni 2016). Leveraging data from the Bureau of Economic Analysis, the Bureau of Labor Statistics, and the Federal Reserve’s Distributional Financial Accounts, we divide households into five income groups. We also estimate household-specific emulation effects to capture “keeping up with the Joneses” dynamics.
We test three scenarios. In the first, the bottom 20 percent of households raise their autonomous consumption. The result is a modest growth shock, with the main effect being more debt for the bottom 20 percent themselves. As a result, income inequality rises slightly as interest income shifts toward capital. In the second scenario, the “emulation motive” leads all but the top 20 percent to increase their spending. When emulation drives up consumption, growth is stronger, but debt builds up quickly, especially in the middle quintile. Income distribution drifts further away from wages and toward interest, as the top 20 percent increase their share in income. The third scenario looks at what happens when the middle 20 percent alone raises its spending. Growth improves more than in the first scenario, but debt accumulates in the middle class, rising by about 80 percent relative to the baseline (see Table 1).
Table 1: Main Results from the Simulation
| Scenario | Quintile | Income Growth | Debt Accumulation | Distributional Effects |
| 1. Bottom 20% autonomous consumption (no emulation) | Q1 | ↑ (long run) | ≈ | Wage share declines; Income Gini ↑ slightly; Wealth Gini unchanged; Top 20% share ↑ (except Q1 wealth); IFC drops |
| Q2 | ↑ | ↓ | ||
| Q3 | ↑ | ↓ | ||
| Q4 | ↑ | ↓ | ||
| Q5 | ↓ (after ↑ spike) | ↑↑ (6% → 4%) | ||
| 2. Emulation trigger (all but top 20%) | Q1 | ↑ | ↓ | Wage share declines; Income Gini ↑ slightly; Wealth Gini ↓ marginally; Top 20% share ↑; IFC drops |
| Q2 | ↑ (lags cons.) | ↓ | ||
| Q3 | ↑ (lags cons.) | ↑ (slow build-up) | ||
| Q4 | ↑ (weaker) | ↓ | ||
| Q5 | Initial ↑ then ↓ | ↑↑ (strongest) | ||
| 3. Medium 20% autonomous consumption | Q1 | ↑ | ≈ | Wage share declines; Income Gini ~unchanged; Wealth Gini unchanged; Top 20% share ↑; IFC drops |
| Q2 | ↑ | ↓ | ||
| Q3 | ↑ (weaker) | ↑↑ (up to +80%) | ||
| Q4 | ↑ | ↓ | ||
| Q5 | ↑ | ↓ (slight long-run uptick) |
Source: own elaboration
Across all scenarios, some patterns are clear. First, rising debt tends to reduce the wage share, as interest income flows to banks and capital owners. In particular, the top 20 percent experience gains in both their share of income and share of wealth. Second, emulation appears to be a double-edged sword: it boosts demand and growth in the short run but increases inequality over time. Third, diversification in income sources for households in all simulations goes hand in hand with an increase in the concentration in incomes at the top, as pointed out by Ranaldi and Milanovic (2020) for the US.
The analysis helps to explain why consumption inequality has not risen as fast as income inequality: households, especially in the middle, have been using debt to keep up. While this sustains demand in the short run, it leaves both households at the bottom of the income distribution and the economy as a whole more fragile. Straightforward policy implications ensue: strategies aimed at boosting consumption via credit, without accompanying redistributive mechanisms, may yield unsustainable outcomes. Conversely, policies promoting a fairer income distribution, thus reducing the need for borrowing to finance consumption could enhance both macroeconomic stability and household financial resilience.
REFERENCES
Bertrand, M. and A. Morse. 2016. “Trickle-Down Consumption.” The Review of Economics and Statistics 98(5): 863–79.
Christen, M. and R. M. Morgan. 2005. “Keeping Up with the Joneses: Analyzing the Effect of Income Inequality on Consumer Borrowing.” Quantitative Marketing and Economics 3(2): 145–73.
Duesenberry, J. S. 1949. Income, Saving and the Theory of Consumer Behavior. Cambridge, MA: Harvard University Press.
Fierro, L. E., F. Giri, and A. Russo. 2023. “Inequality-constrained monetary policy in a financialized economy.” Journal of Economic Behavior & Organization 216: 366–85.
Frank, R. H., A. S. Levine, and O. Dijk. 2014. “Expenditure Cascades.” Review of Behavioral Economics 1(1–2): 55–73.
Kapeller, J. and B. Schütz. 2014. “Debt, boom, bust: a theory of Minsky-Veblen cycles.” Journal of Post Keynesian Economics 36(4): 781–814.
Nikiforos, M. and G. Zezza. 2018. “Stock‐Flow Consistent Macroeconomic Models: A Survey.” Journal of Economic Surveys 31(5): 1204–39.
Pariboni, R. 2016. “Household consumer debt, endogenous money and growth: A supermultiplier-based analysis.” PSL Quarterly Review 69(278): 211–34.
Ranaldi, M. and B. Milanović. 2022. “Capitalist systems and income inequality.” Journal of Comparative Economics 50(1): 20–32.
Ruggeri, F. 2023. “Housing market, household debt, financial accelerator, and stagnation in a Stock-Flow Consistent model.” Bulletin of Political Economy 17(1): 111–43.
Szymborska, H. K. 2022. “Rethinking inequality in the 21st century–inequality and household balance sheet composition in financialized economies.” Journal of Post Keynesian Economics 45(1): 24–72.