

Economic Inequality and American Elections: A Reprise
by James K. Galbraith
In 2020, Jaehee Choi and I published an article on the relationship between economic inequality and presidential election outcomes in the United States, up to and through 2016. We argued that the main force driving US presidential results in each state was (and is) the economic composition of the electorate in that state. This composition is highly predictable from one election to the next, yet subject to measurable evolution over time. Our thesis thus bypassed the standard “median voter” view in political science, with its attention to the issues with which “swing voters” are supposedly concerned.
We showed that the Democratic Party has become a party of the distributional tails: its voters are high-income urban professionals on one side and low-income minorities on the other. When the tails are “fat”—when the two tails combined exceed half of the voting population—the state votes Democratic. The Republican electorate is concentrated in small cities, suburbs, towns and rural areas, and is predominantly white. By and large, this group is found in the middle of the US income distribution. Thus, highly unequal states vote Democratic, while egalitarian ones (with exceptions, like Vermont) are Republican more often than not. This has nothing to do with what voters think of inequality, if they think about it at all. It has to do with who they are and their social position in their home states.
To test our hypothesis we needed to measure inequality accurately within states. This could not be done for years before 2000 from annual national surveys (the Current Population Survey) because sample sizes for small states were too small. So we used a technique based on payrolls, as a proxy for incomes, measuring inequality across sectors in Employment and Earnings data, and calibrated our results to the decennial census. Our findings strongly backed the hypothesis. In a stunning example, all 14 states with the largest increases in inequality from 1969 (or 1992) to 2014 voted for Hillary Clinton in 2016. Of course, when a state tips to either party, with very limited exceptions, one hundred percent of its Electoral Votes go to that party.
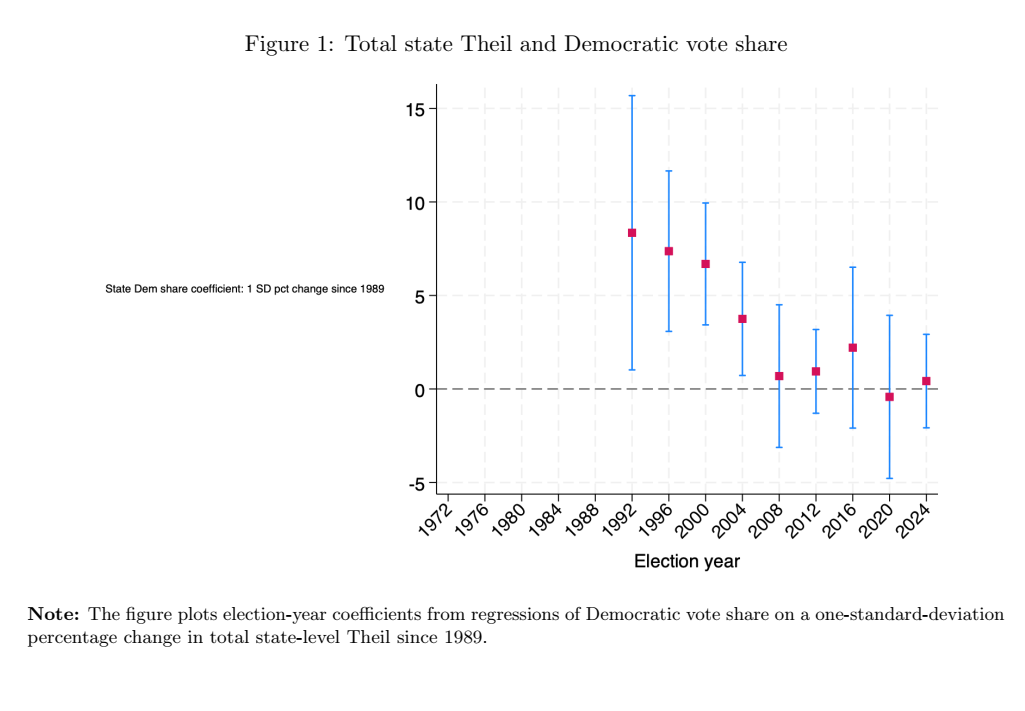
We have recently updated and deepened our measures, using inequalities calculated within and between counties in each state, and aggregated to obtain state-level inequality measures. The results, in relation to presidential election outcomes, are shown in Figure 1. They support the relationship found in our previous work but indicate that the link disappeared in 2020 and 2024. Why? In part, these were wave elections, of repudiation and then redemption for Donald Trump. But there is also evidence that by 2024 the ties binding low-income minorities, especially Hispanics, to the Democratic Party had weakened. Even in 2020, Trump did better with every demographic group, except for white men, than in 2016. In 2024, Hispanic voters shifted his way, thanks partly to improved economic conditions, especially along the border—a factor decisive in the Texas border counties.
In the recent data, inequalities continue to rise in a few large states, notably California, Virginia, Massachusetts, and Maryland, and it remains high in New York. In the heartland, however, statewide inequality has mostly fallen since around 2010. This is probably due to a decline in well-paid manufacturing, leaving a landscape of mediocre but egalitarian jobs in services. No one should suppose this attractive for those living in the affected states, for it means a lack of better opportunities and chances for promotion as life goes on. Too little inequality can be as bad as too much.
Meanwhile, across the South and Southwest, inequalities continue to rise. In Georgia and Arizona this is consistent with the Democratic tilt in Senate races and in the presidential outcomes in 2020. In Alabama and Mississippi the drift is similar but the starting point is much further back.
Texas is the crucial case. Barack Obama won 40 percent of the Texas vote in 2012; Hillary Clinton won 43 percent in 2016; Joe Biden won 46 percent in 2020. Then came the 2024 Trump blowout. Whether the second Trump presidency will bring Hispanic voters back to the Democrats, and resume the drift from 2026 to 2028, is a key issue in the midterms and perhaps the single most important issue in the future of American presidential politics. Barring another “wave” election (as in 2008, 2020, and 2024) that renders our model irrelevant, a switch of Texas’s electoral votes to the Democratic column, driven by demography and economics, would be an earthquake in the political landscape, similar to that of New York in the 1970s and California in the 1990s.
The entrenchment of the Democrats in the highest-inequality states also eases the rise of democratic socialism, but only in those states—apart (possibly) from some deep-red states like Florida where the party is far from power. Wherever states are competitive, the risk of a split turning narrowly-blue states to the Republicans precludes such experimentation, which is why a conformist centrism dominates the Democrats outside of a small group of jurisdictions. In the South, especially, the drift toward the Democrats appears to have no revolutionary implications. That the Democrats nationally might be open to a socialist takeover, sweeping out the deadwood that has controlled the party since the previous century, seems to be the most remote and improbable chance.
What does all this mean for the midterms? The predictions are of a Democratic wave—as they were in 2016 until the very end. From our analysis, perhaps that wave may face headwinds in states that have been drifting toward the Republicans thanks to the equalizing effects of relative economic decline. Perhaps Democrats may get a modest boost from the long-ongoing increasing inequalities in Texas, as well as in Georgia, Arizona, and other parts of the South and Southwest.
But as Brazilians know, reputations and money are easily lost by betting on election outcomes—even up to the last minute. I’ll believe in the blue wave after it happens.
**
Senior Scholar James K. Galbraith teaches at The University of Texas at Austin. His new book is The Power to Destroy: How Bad Economics Drove America’s Decline (Chicago, 2026).