The Fed Lowered Rates Again. Is It Really a Surprise?
The whole world was watching on December 10, 2025 to finally find out what the Fed was going to do. Big money bets were placed—would the Fed leave rates unchanged (potentially exposing the Board of Governors to the wrath of President Trump) or would they lower it—and if so, by how much? Even regular Americans now gamble on the Fed’s decision ($300 million for the September meeting alone) through “prediction markets” (Gratton 2025).
The Fed’s decision was supposedly made much more difficult because the government shutdown caused the BLS to abandon collection of October’s data. They were “flying blind”—to coin a phrase we have been using at Levy for three decades now. How could these technocrats possibly make a decision without knowing precisely how many hundredths of a percentage point the rate of inflation and the unemployment rate might have moved in October?
Trump’s attacks on the Fed have added an additional factor the Fed needs to consider: appearances. Would lowering rates again (or too quickly?) leave the impression that the Fed was swayed by the executive branch? Indeed, Matt Klein (2025) recently argued that the Fed’s cutting interest rates—despite FOMC members being relatively optimistic about the economy (and while inflation is running above target)—indicates that politics may be at play.
The outcry over the attack on the sacred independence of the Fed—the one institution of government that must be kept free from political influence—stems in large part from the belief that monetary policy is (or should be) apolitical. The Fed, alone, must choose its target and must be free to decide how to go about hitting it. How dare anyone suggest that politics might enter into such an important deliberation!
But monetary policy is anything but apolitical. Decisions about what to prioritize—unemployment, economic growth, price stability, financial stability—are political, especially if there are tradeoffs between these goals. The Fed’s decisions about which financial institutions and sectors to support, like those made during the Global Financial Crisis, are not apolitical either. Lastly, interest rate policy (and the Fed’s position regarding asset price inflation) has repercussions for income distribution that have long been ignored. Since monetary policy is inherently political due to its impact on the economy and the citizenry, Congress must be more involved in providing guidance than it has been traditionally.
Furthermore, even if the Fed wanted to achieve the congressional mandates—interpreted to include pursuit of full employment and price stability—it simply does not have the tools to do so. It has one tool—the overnight interest rate—which is not very effective for achieving either of its goals.
In this policy note we will make the case that monetary policy is necessarily political, as it must choose winners and losers, that the Fed does not have a coherent theory to explain how its policy can stabilize prices, and that it does not have the tools that would allow it to comply with the so-called dual mandate.
The Fed’s Commitment to Price Stability
As established by Congress, the Fed has a dual mandate (it actually consists of at least three goals, depending on how one counts them: maximum employment, stable prices, and moderate long-term interest rates;[1] and many also include robust growth). However, since at least the Volcker era, the Fed has largely been preoccupied with price “stability.” Chairman Greenspan defended the Fed’s policy framework arguing that pursuit of the inflation target would allow it to hit all the congressional mandates. He argued that price stability is a precondition for stable economic growth that also generates jobs. Prices are supposed to be the market mechanism that sends signals to producers about what to produce and how much, and prices adjust to clear markets and aid in the optimal and efficient allocation of resources. The role of the central bank is to ensure that monetary factors do not distort prices or, therefore, resource allocation. Once that is dealt with, the free market will ensure economic growth with full employment and price stability.
Chairman Bernanke later adopted an explicit inflation target of 2 percent in 2012, although this had been the Fed’s implicit target for many years prior. When pushed during congressional testimony, Chairman Powell admitted that central bankers had effectively pulled this number out of thin air. The justification usually goes as follows: ideally, we would want no inflation, but that puts us too close to deflation. Since our measures of inflation are not perfect, it is better to err on the upside. Hence 2 percent has become the magic number—first adopted by the Central Bank of New Zealand in 1990, followed by Canada a few short years later. Over time, the 2 percent target has become the goal of many if not most central banks.
Unlike inflation, however, the Fed does not have a number for the maximum employment side of its mandate. Instead, in official documents, it often refers to “the highest level of employment or lowest level of unemployment that the economy can sustain in a context of price stability.”[2] That means that even 10 percent unemployment can be acceptable if price stability will be compromised by pushing unemployment below that.
To achieve its 2 percent inflation target (and supposedly by extension to achieve the other goals as mandated by Congress), the Fed has only one tool: the overnight interest rate (the federal funds rate in the US).[3] While the Fed could use its role as a supervisor of banks to directly restrict bank lending and depress household and business spending (i.e., use credit controls), in practice the Fed does not use that authority, deferring to “markets” to determine lending and spending.
Fed Lowers Rate Target at December Meeting
After several weeks of frenzied speculation, we now know the outcome of the Fed’s nearly monthly[4] fulfillment of its solemn duty to hit the inflation target: the federal funds rate will come down by 25 basis points. It takes a hundred of those to amount to one percentage point. If you invested $100 now, compounded at that interest rate, you would have the grand total of $102.53 in ten years—two and a half bucks of interest. Or, if you owed money, that rate reduction would save you $2.53 on every hundred dollars you owed over the next ten years of payments. It is not much, but it adds up. Markets mostly nodded in approval: Yep, that’s what we expected. Still, truckloads of dollars changed hands as bets were settled.
Adding to the suspense, in recent years members of the Federal Open Market Committee (FOMC) have often disagreed over what to do. This was the third rate cut in a row, and the fourth decision in a row, with a split vote. Two members focused on inflation that continues to run above the Fed’s target—they, of course, do not want rate cuts. But one member, Stephen Miran, wanted a deeper cut—there is speculation that he wants to please the president. Oh well, majority rules.
Was there really reason for so much suspense? The New York Times added this graphic to its story of the meeting (Smith 2025):
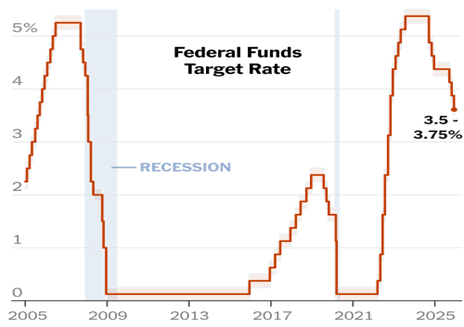
The red line shows the fed funds rate target; the shaded areas indicate recessions. Three rate hikes; two recessions. One wonders what will happen in 2026. Though history does not repeat itself, it often rhymes.
In case the pattern is not clear, it is instructive to look at a longer time frame. Figure 2 is a graph we have been using for several years.
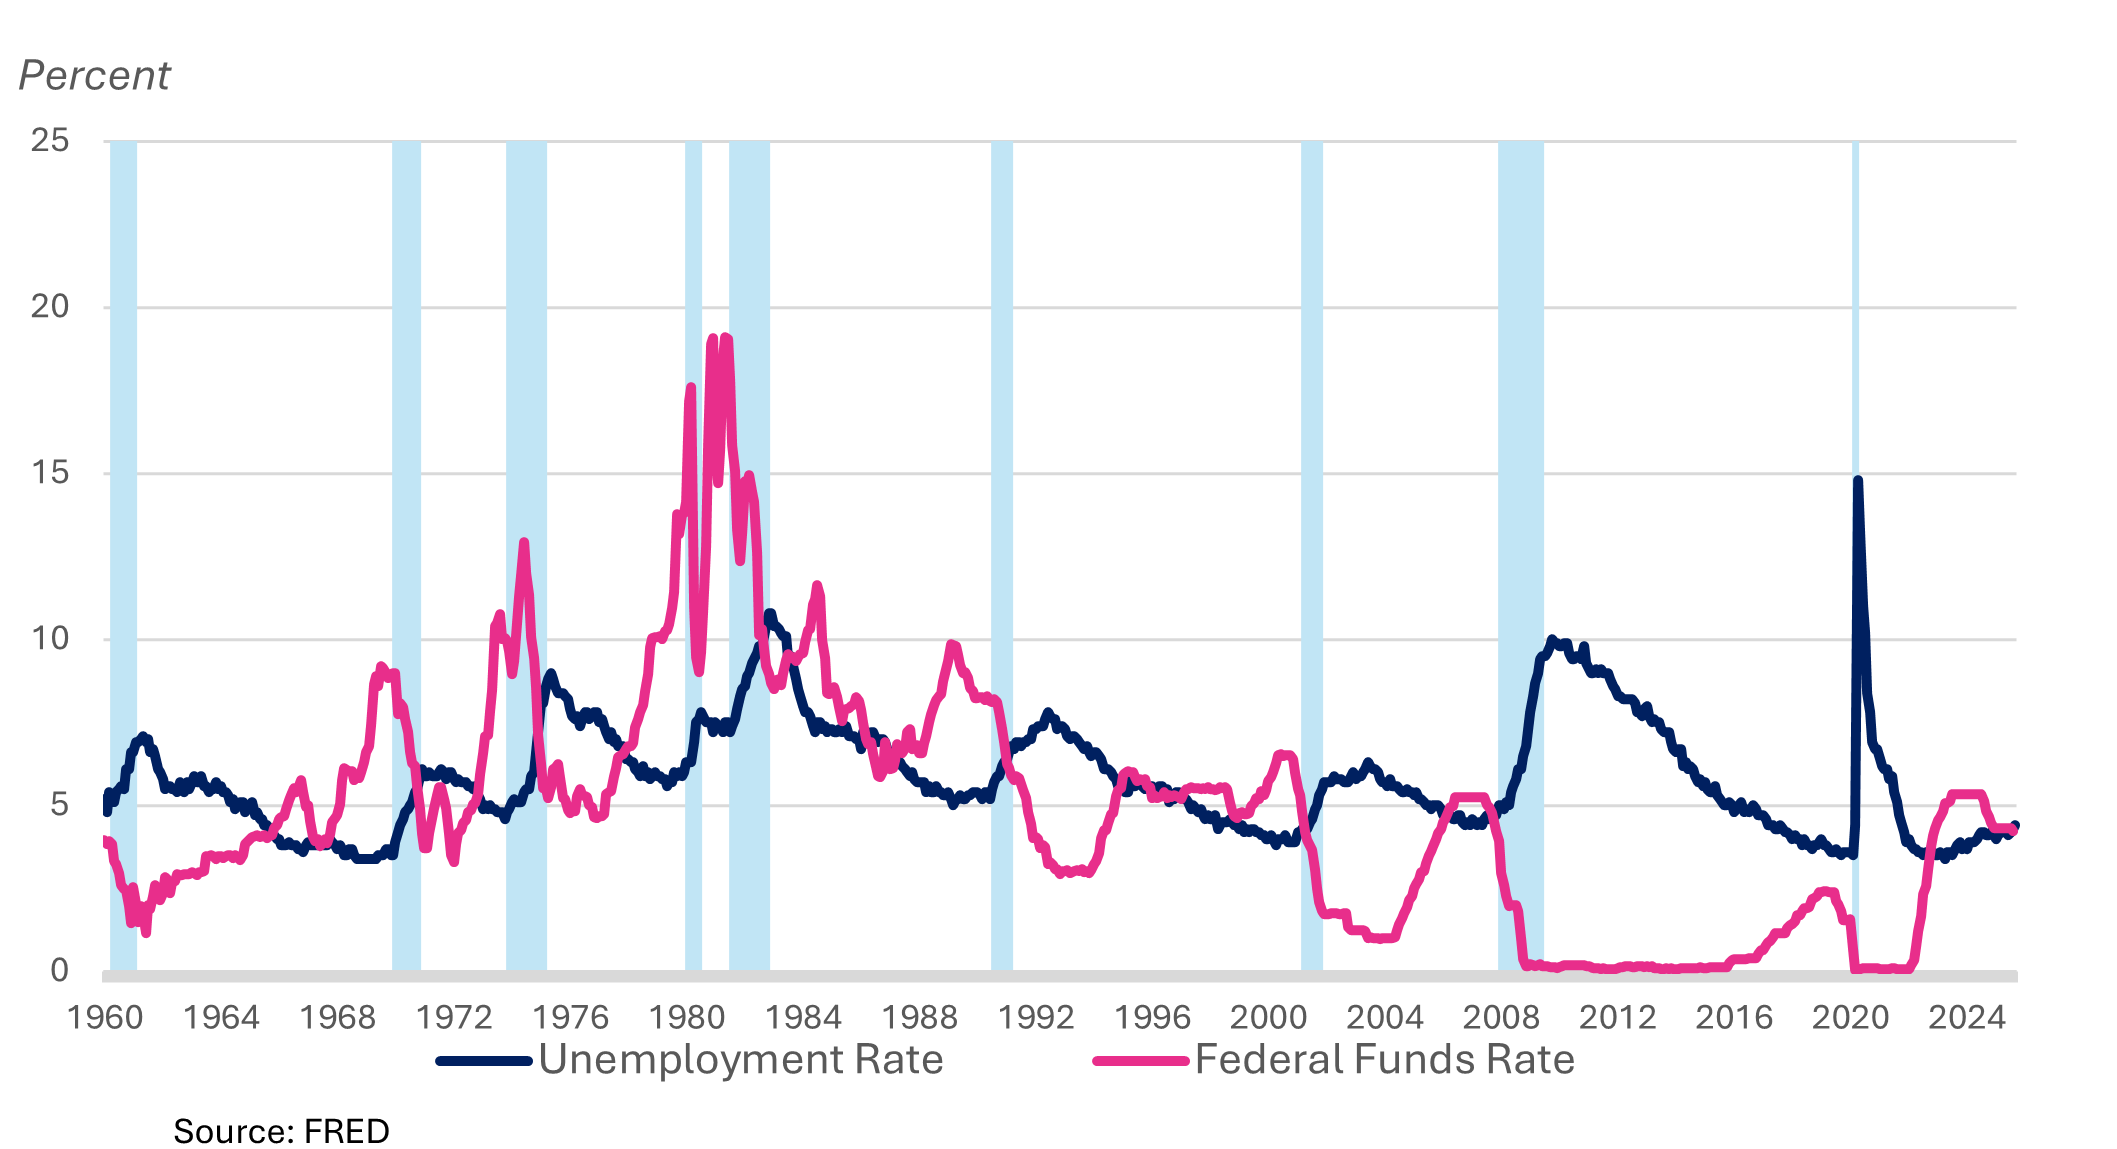
The pink line shows the fed funds rate target while the blue line shows the unemployment rate, and the recessions are shaded. So far, eleven series of rate hikes have been followed by nine recessions. There are more rate hikes than recessions because it occasionally takes the Fed a couple of stretches of rate hikes to obtain the desired result—in both 1984 and 1994 the Fed raised rates during jobless recoveries that were not immediately followed by a recession. But in each case, the Fed raised rates again—and recession followed. Maybe they pulled the trigger a bit early on occasion, but the pattern is clear: the best predictor of recessions is a peak in the fed funds rate.
As Figure 2 shows, the best predictor of a Fed rate hike is a trend of declining unemployment. The graph shows eight periods over which unemployment fell substantially, each followed by a rate hike (again, sometimes more than one rate hike). Thus, the peak of the fed funds rate occurs at the nadir of the unemployment rate; and the nadir of the fed funds rate is reached as the economy reaches the cyclical low of the unemployment rate.
By this metric, a recession is likely already underway as we appear to have already passed the nadir of unemployment for this cycle. (Note that we are not claiming that the Fed necessarily causes the recession—only that a Fed rate hike is followed by recession.)
The Fed’s prescient ability to predict a recession, and to cut rates as we move into it, approaches as close to perfection as any economic relationship we have been able to find.
To sum up, the Fed’s rate reductions are a good indicator that the recession has already begun. Given the unprecedented bubble in tech stocks (especially anything related to AI), the huge data center–related debts that will generate defaults, and crypto frauds that now infect financial institutions as well as retirement savings, this looks more like 2007 than 1999. In other words, not just a recession but also a financial crisis could be in our future.
Demise of the Phillips Curve
It could be argued that the Fed is not really targeting employment (i.e., raising rates when the unemployment rate is perceived to be too low). Indeed, the Fed claims it is targeting inflation and perhaps inflation and unemployment move in opposite directions. That would be consistent with the Phillips curve relationship: low unemployment causes inflation—so an inflation target would cause the Fed to raise rates when unemployment falls to a level that would accelerate inflation.
Let’s see if the Fed was using rate hikes to fight inflation.
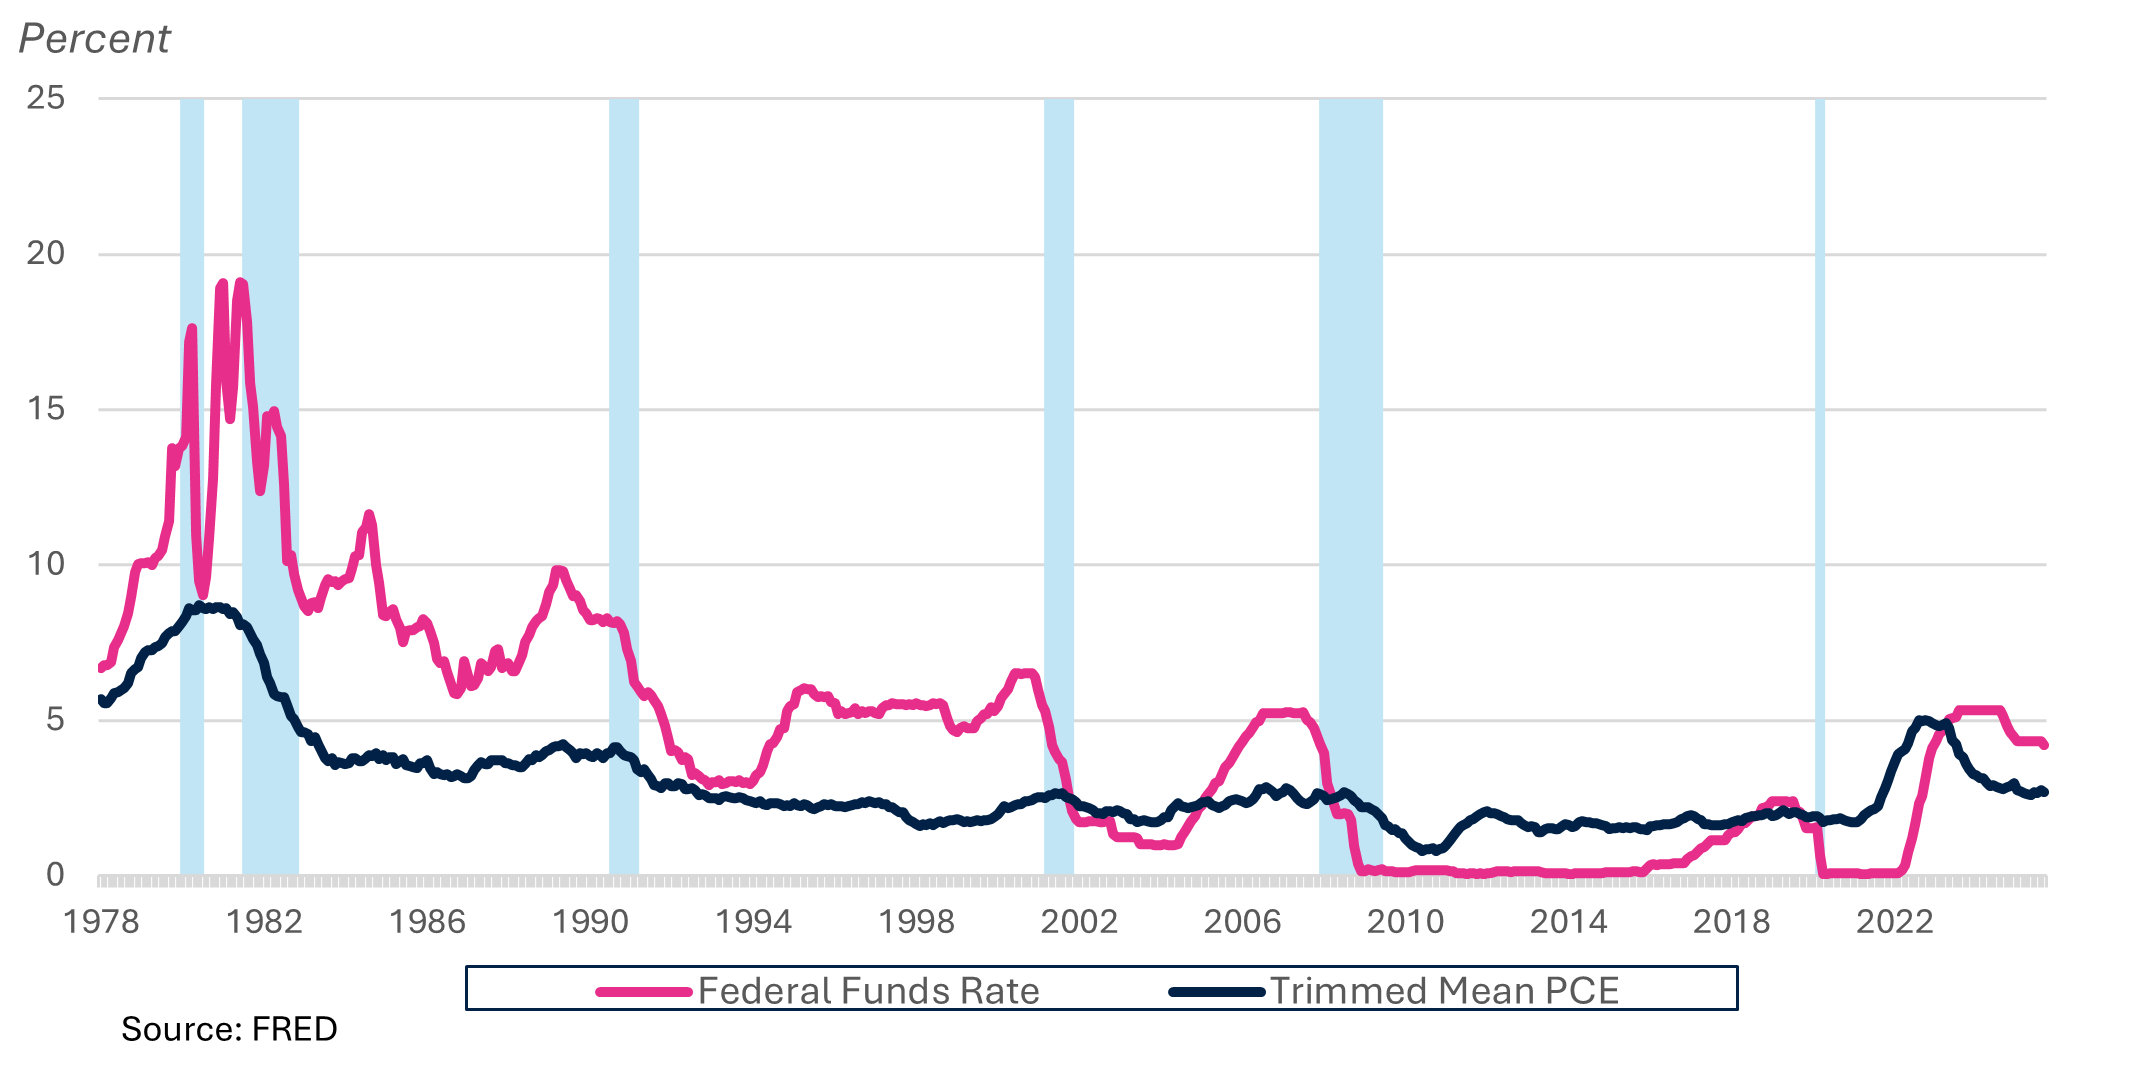
As Figure 3 shows, from 1980 to the end of the 1990s, inflation was on a sharp downward trend but the Fed kept rates high and with wild swings that are not correlated with inflation—but are correlated with unemployment as shown in Figure 2. From the mid-1990s to the COVID inflation, inflation fluctuated within a very low range, often below the Fed’s 2 percent target. Lowering the fed funds rate to zero and holding it there for half a dozen years after the Global Financial Crisis had no obvious impact on inflation, and yet the Fed was extremely active for most of the 30 years after 1990, even with stable inflation up to the COVID pandemic’s inflation. Clearly, it was not fighting inflation over much of that period.
Furthermore, by the 1990s, Fed officials such as Alan Greenspan were already casting doubt on the unemployment–inflation tradeoff. At the time, Greenspan argued that productivity increases had made the relationship weak (e.g., if the economy grows, but so does productivity, there is no need for demand to outstrip capacity). Yet, he began another preemptive tightening cycle in 2004 (without evidence of inflation and during a nearly jobless recovery), which was inherited and continued by Ben Bernanke. We needn’t provide a reminder of the global financial catastrophe that followed that tightening of policy.
It took the Fed about three decades to finally come to the conclusion that preemptive interest rate hikes were not a good idea. Indeed, in 2020 the Fed completed a comprehensive review of its framework, concluding that the Phillips curve does not exist. As Jerome Powell testified to Congress in 2019, “the connection between slack in the economy or the level of unemployment and inflation was very strong if you go back 50 years and it’s gotten weaker and weaker and weaker to the point where it’s a faint heartbeat …” (Powell 2019). Federal Reserve Vice Chair Richard Clarida (2019) agreed: “Another key development in recent decades is that price inflation appears less responsive to resource slack. That is, the short-run price Phillips curve—if not the wage Phillips curve—appears to have flattened, implying a change in the dynamic relationship between inflation and employment.”
Furthermore, in a revealing statement, New York Fed President John Williams (2019) said: “The Phillips curve is the connective tissue between the Federal Reserve’s dual mandate goals of maximum employment and price stability. Despite regular declarations of its demise, the Phillips curve has endured. It is useful, both as an empirical basis for forecasting and for monetary policy analysis.”
Note how Williams emphasizes that the Phillips curve connects the two main components of the dual mandate: it allows the Fed to pretend that it is fighting inflation when it leans against employment. If the Phillips curve is truly dead, though, the Fed can no longer claim that it is fighting job creation in the name of achieving its inflation goals.
The Fed’s New Consensus Policy Framework
The death of the Phillips curve left the Fed in a tight spot. If it cannot use the unemployment rate to predict impending inflation (and to then raise rates to fight incipient inflation), what is left?
Economists have lamented the delays in data on unemployment and inflation due to the government shutdown (and the administration’s disdain for releasing inconvenient data), and warned the Fed is flying blind in the absence of data. However, the Fed has been flying blind for three decades, as we at Levy have argued[5]—and it is not due to a lack of data. Rather, the main issue is that the Fed does not have a “working theory of inflation” it can use in its policymaking, as even Fed insiders admit.[6] Indeed, leaving aside the obvious fact that the Fed almost always misses that 2 percent target, no one inside or outside the Fed has a plausible explanation of how monetary policy “works” to bring inflation under control.[7]
The latest groupthink relies on the Fed’s supposed control over inflation expectations—although that plainly has not worked over the past dozen years. The idea is that inflation is determined by expected inflation—as if expecting that pony for Christmas will make Santa deliver it. If we all expect inflation, we make it come true by behaving in an inflationary manner. Workers demand wage increases because they expect prices to rise; prices rise because we all run out to buy stuff before prices increase; firms raise prices because they expect costs to go up. Voila! Expectations deliver inflation.
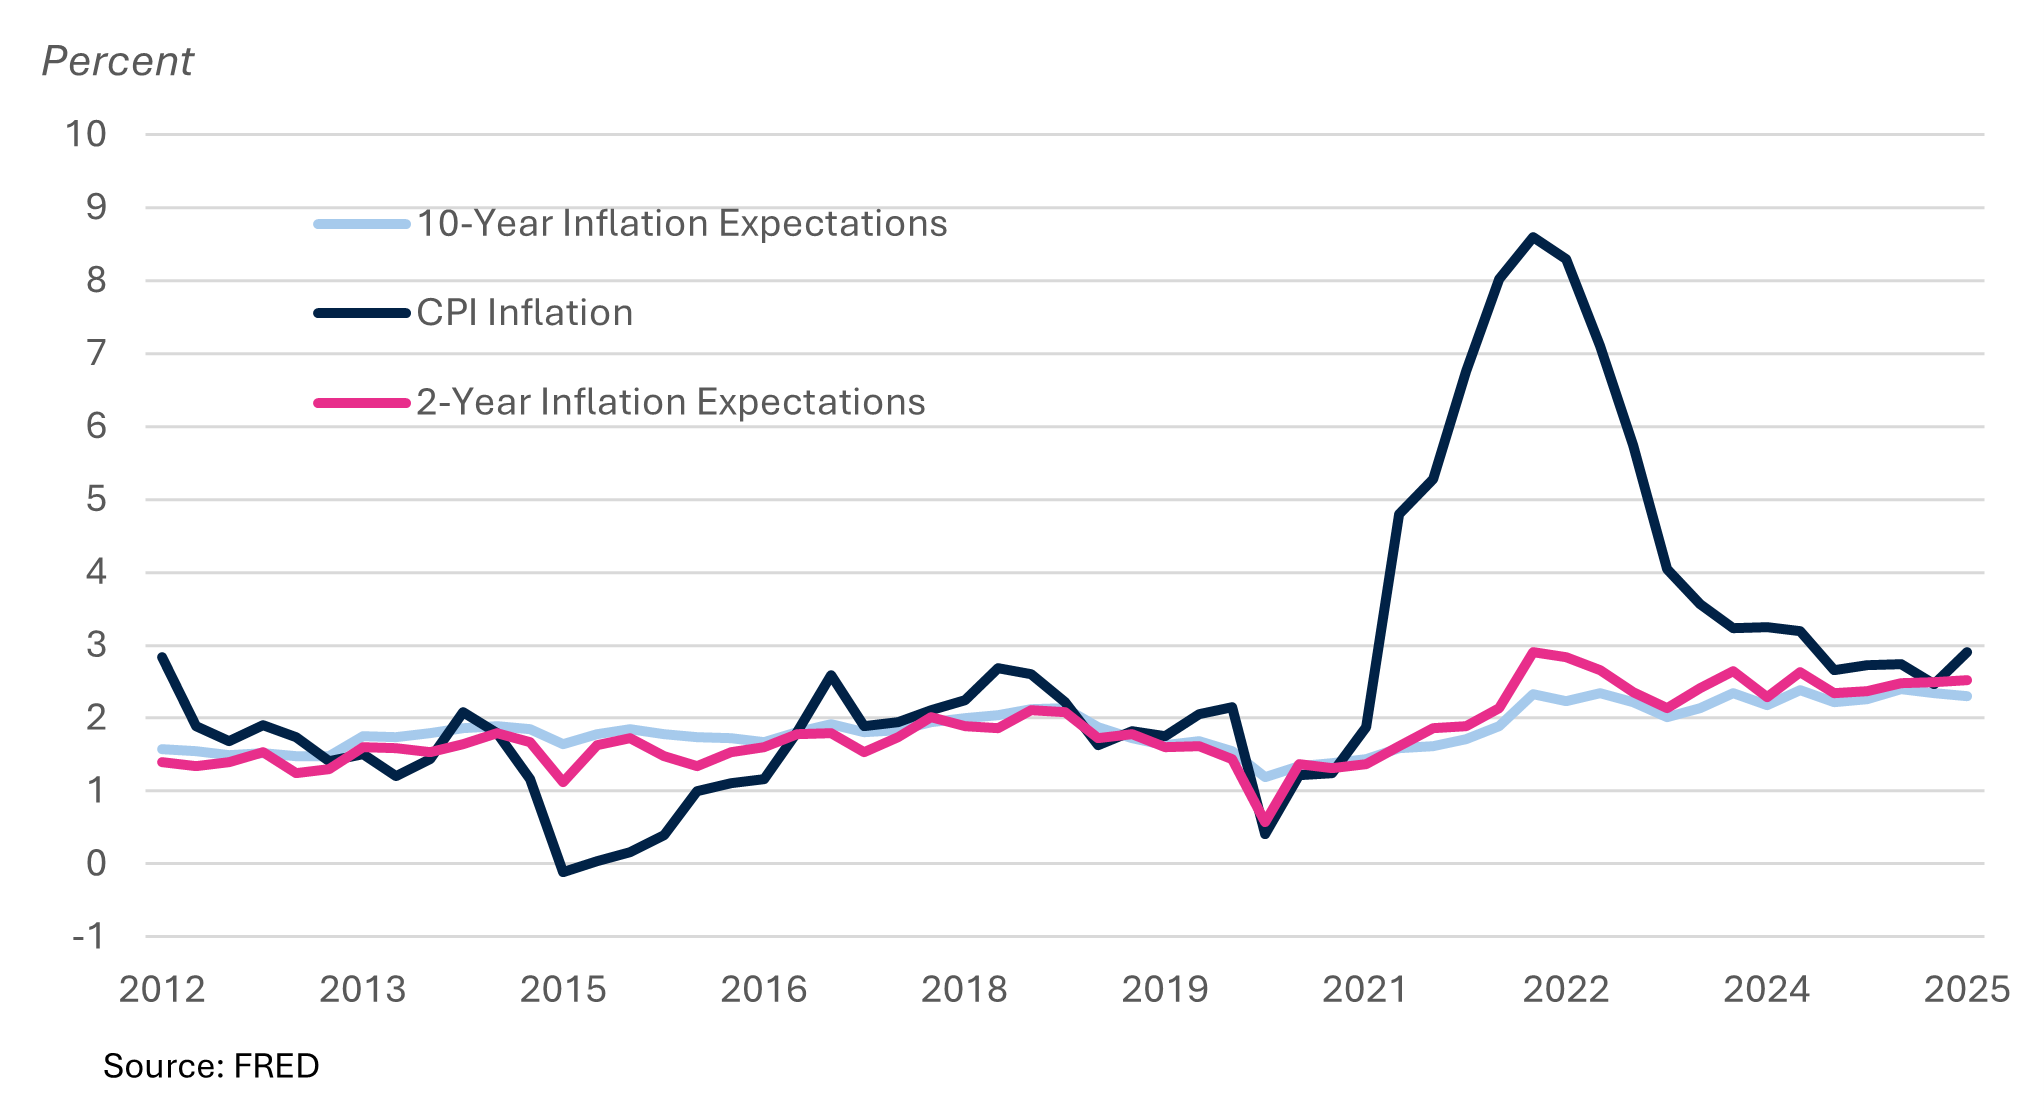
This is not, however, what the data show. As Figure 4 demonstrates, while inflation fluctuated between 0 and 2 percent for almost a decade, expectations remained constant at 1 to 2 percent for the entire period up to 2021. In the COVID era, actual inflation shot up to almost 9 percent—long before expectations, which rose only very gradually. As Powell continuously insisted, with expectations “well-grounded,” the inflation would be “transitory.” While transitory has become a bad word that no one can ever utter again, the truth is that inflation was mostly due to supply chain disruptions and some price gouging by suppliers (Nersisyan and Wray 2022). It had nothing to do with expectations and would come down with recovery from those disruptions. Powell was right to resist the inflation hawks, and wrong to reverse course under pressure.
As usual, however, the Fed’s timing was impeccable, raising rates when the economy reached peak employment.
After the economy sank into the deep pandemic-caused recession, the Fed again lowered rates to near-zero and held them low even as inflation rapidly gained speed. Those low rates should have been interpreted by markets as the Fed’s confidence that inflation was transitional, and, by controlling inflation expectations, the Fed would ensure that it was temporary—since expectations supposedly determine inflation. It worked in theory but not in practice. All the years of building credibility at inflation-fighting apparently could not withstand a few months of abnormally high inflation in the environment of a supply shock. The Fed abandoned its theory and raised rates sharply, triggering the second, third, and fourth biggest bank failures in US history.
So much for New Consensus policymaking. The Fed cannot control expectations and inflation is not significantly impacted by expectations. If anything, expectations—eventually—revert to reality.
Implications for Fed Policy
What now? At the December meeting, the Fed faced what it perceived to be inflation that remains stubbornly above its target (never mind that most of it is due to imputed rentals on owner-occupied housing and to actual rents charged by the private equity monopolizing rental units), but with a weakening labor market and economy more generally. The Fed chose to lower rates but with a split vote.
When questioned about the lack of unanimity, Mr. Powell said that divisions were only natural, given the complicated environment the central bank is navigating. He said he could have made the case either way for the Fed to cut interest rates or pause reductions, describing it as a “close call.”
“You’ve got one tool,” he said. “You can’t do two things at once.”
In other words, he is saying that you must choose to fight inflation or to fight unemployment—so this time they chose to fight unemployment. Yet recall that Greenspan had claimed that fighting inflation generates low unemployment. Apparently, today’s Fed rejects that notion.
This brings us to the issue of the Fed’s sacred independence, which many interpret as the proposition that the Fed must make decisions based on cold, hard facts without political influence. And the Fed itself must avoid politics. Yet, the decision to raise rates when unemployment gets too low—even if the consequence of low unemployment would be inflation—is inherently a political decision. And it is a political decision that has had serious consequences for labor over the past half-century.
While we do not blame the Fed for every recession, we do believe that high interest rates depress economic activity by suppressing wage growth while shifting income to high-wealth households that earn interest. Indeed, research shows that monetary tightening is more effective at reducing employment than monetary easing is at stimulating it (Kurt 2024). Households with mortgage, auto, credit card, and student loan debts must cut back on consumption. Construction of housing is delayed. Moreover, changing rates in either direction can have big impacts on the financial sector—rate reductions generally increase financial asset prices (helping to stoke a bubble), while rate increases can crash asset values and impact solvency of financial institutions. Since the Volcker years, the Fed rate hikes have played a major role in every financial crisis.
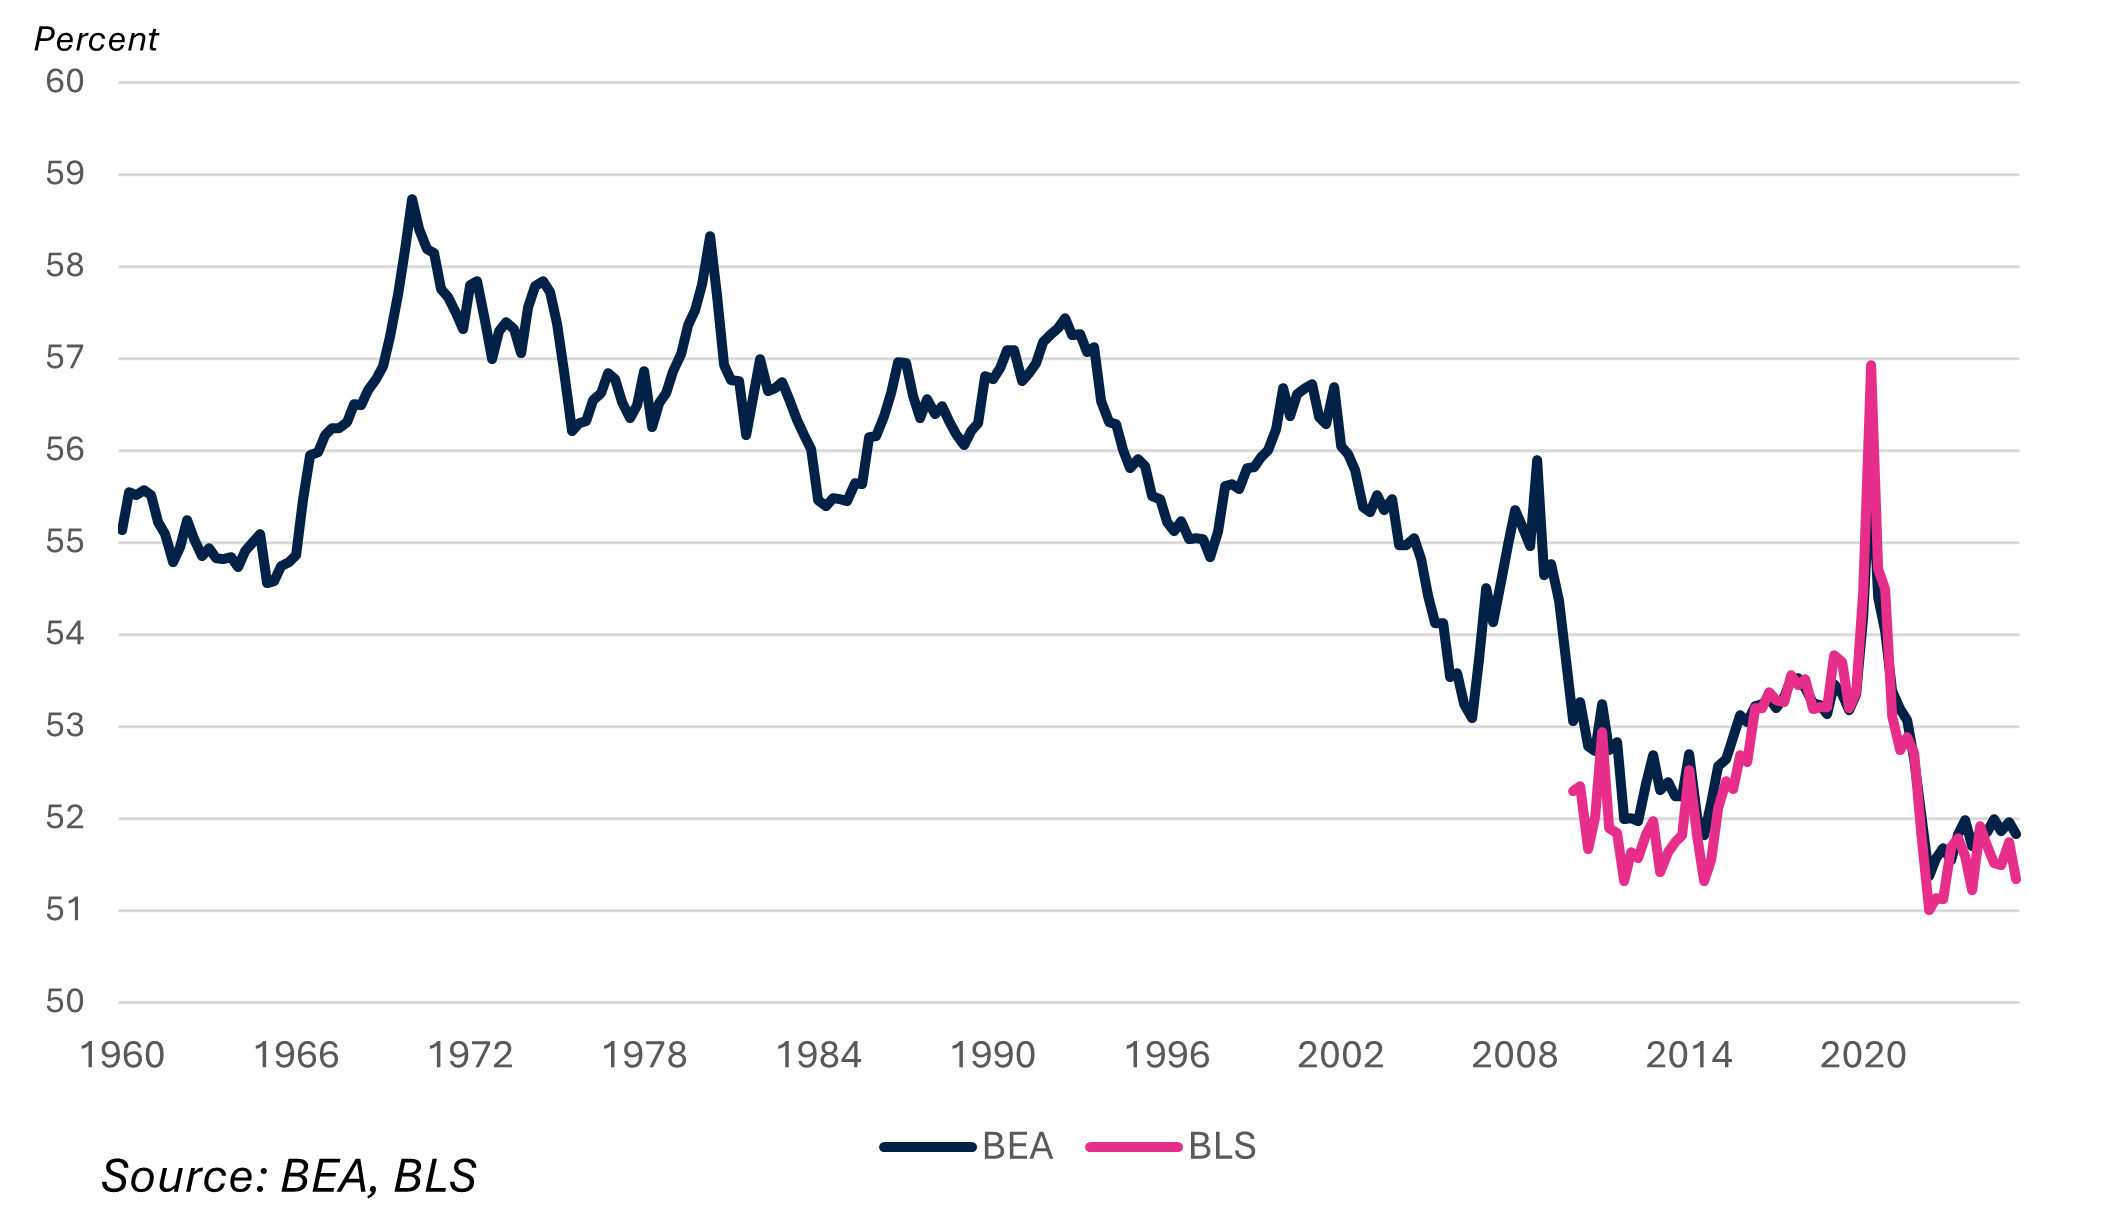
Fed policy has thus contributed to the stagnation of wages and a massive shift of national income away from labor over the past five decades. Since most Americans rely on wages, that shift has increased inequality as income has shifted to interest, profits, and capital gains. As Figure 5 shows, the share of income going to wages has been falling since the early 1970s, with the pace of the transfer of income increasing since around 1990.[8] There has also been a redistribution within the labor market with high-wage workers fairing relatively well compared to those at the bottom of the wage distribution. Indeed, research shows that low- and moderate-wage workers “need lower unemployment rates than their high-wage peers do in order to achieve decent wage growth” (Bivens and Zipperer 2018). By raising rates and aborting recoveries, the Fed has prevented wage gains from trickling down to those workers.
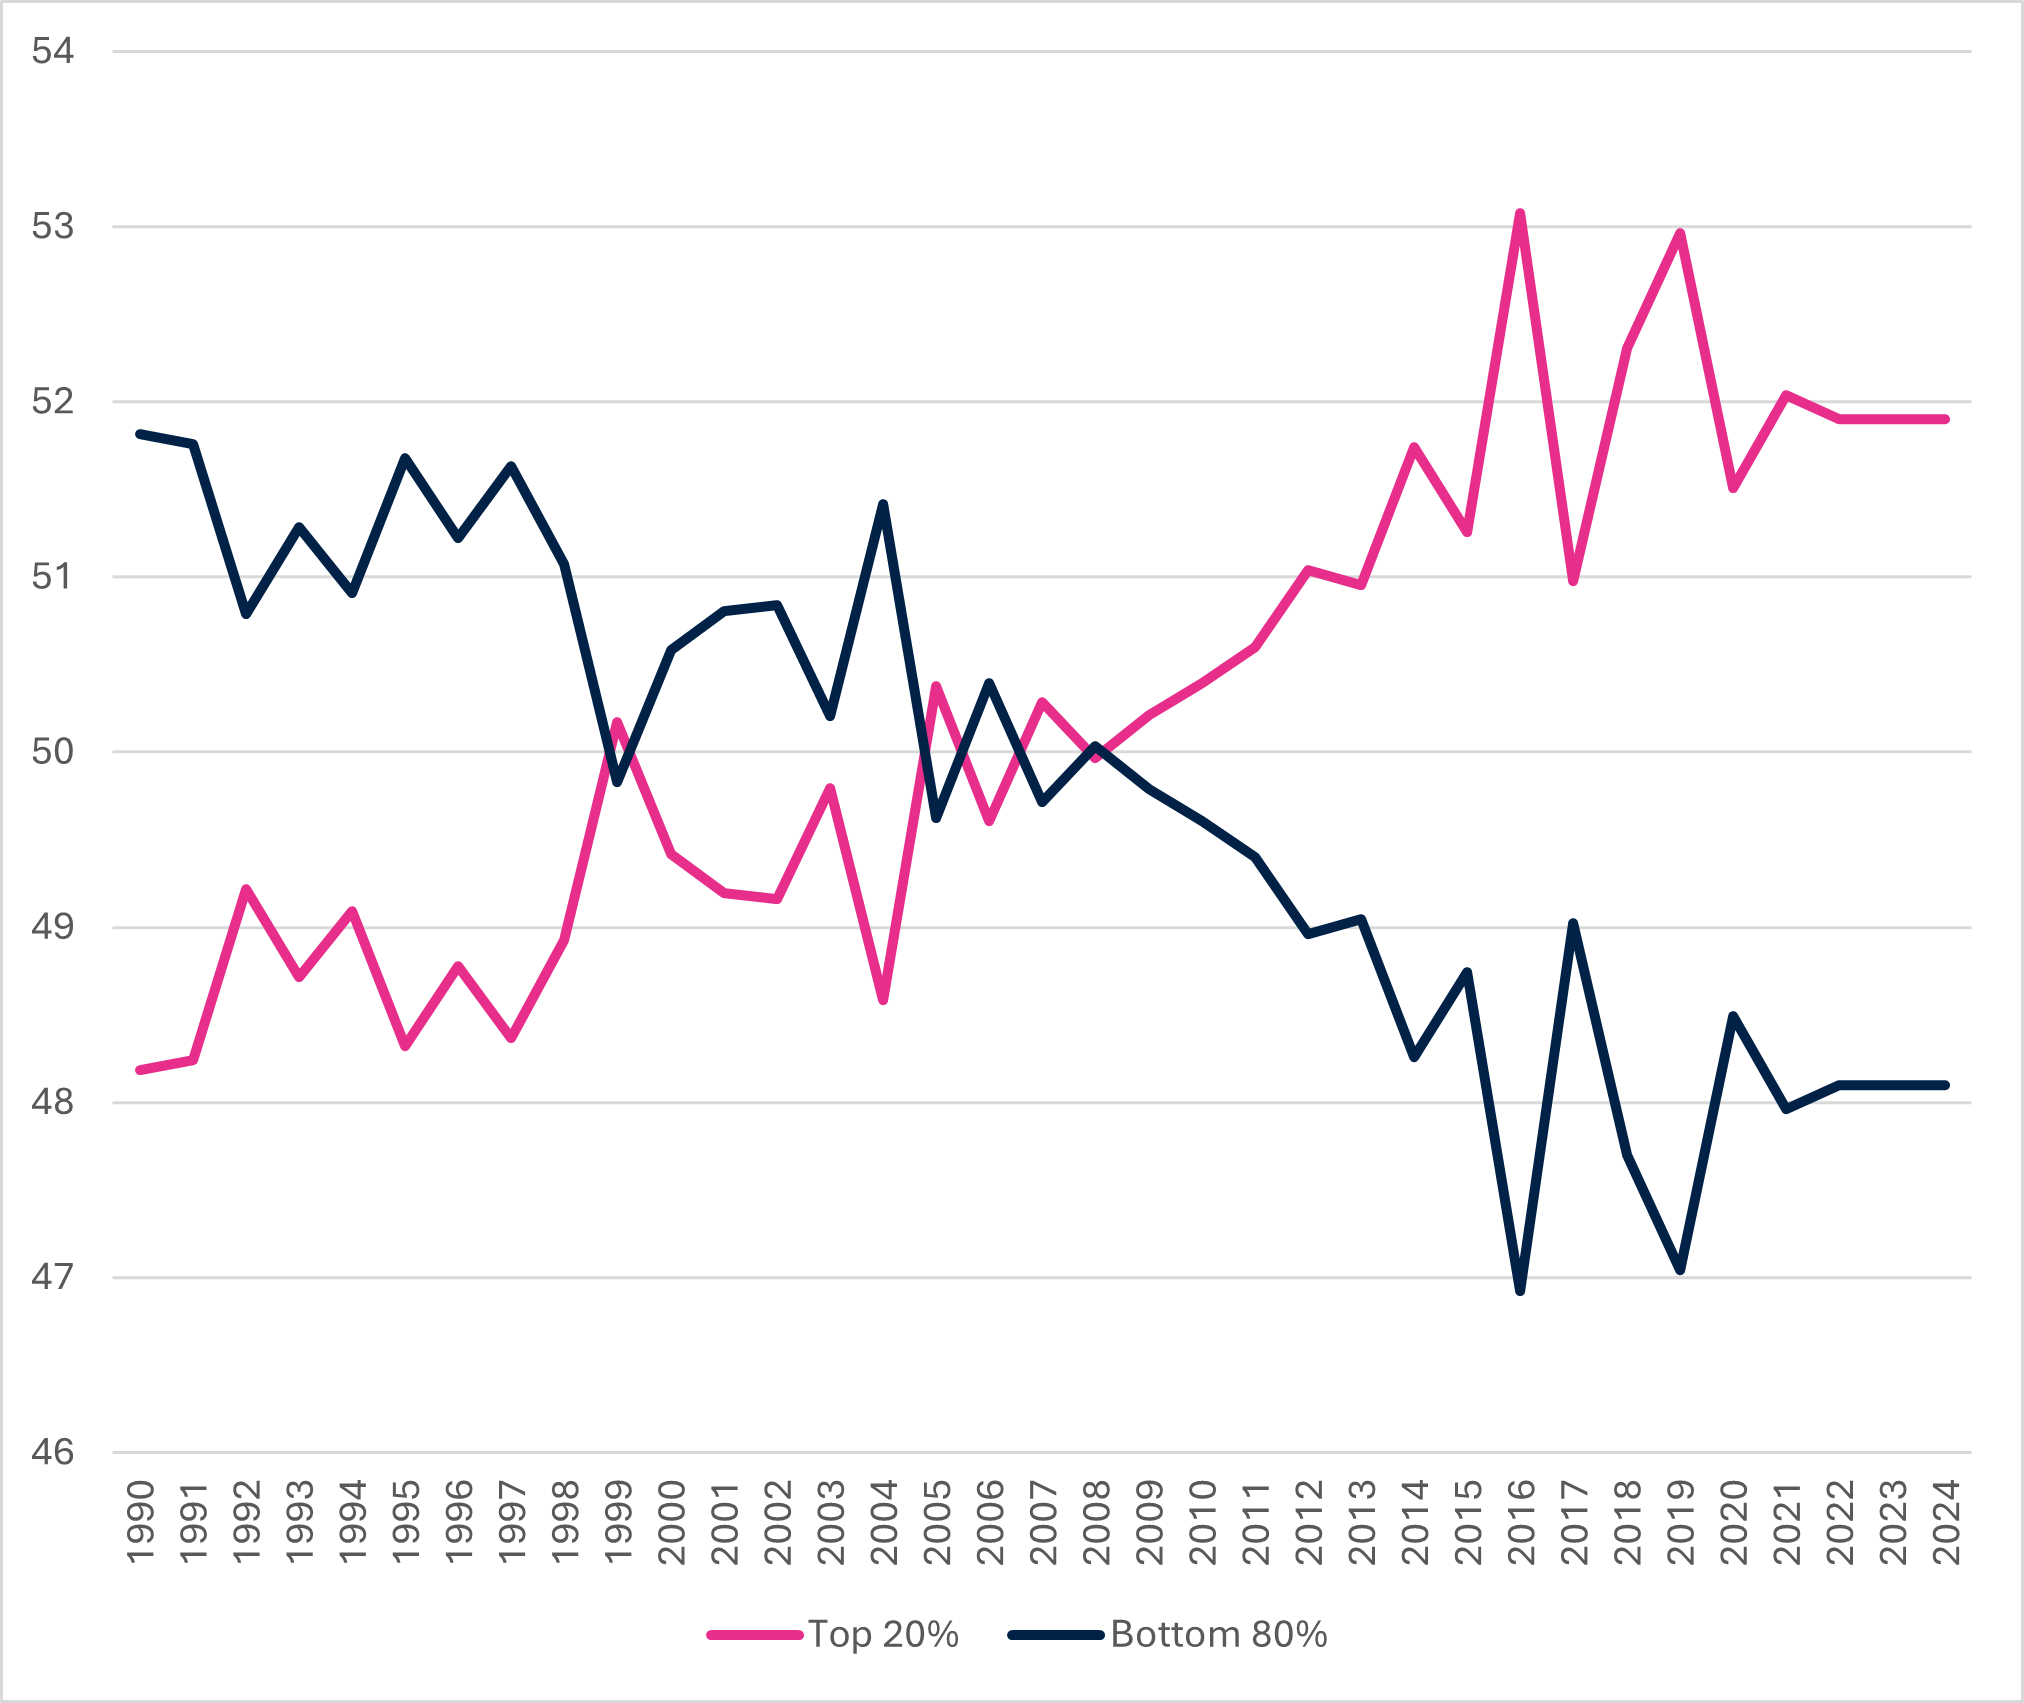
Who has benefited from this shift? Those who receive income in the form of interest and profits, plus capital gains from ownership. These are predominantly higher income earners—so the shift away from wages has increased overall inequality. The share of disposable income going to the top quintile has increased since 1990 at the expense of everyone else and now accounts for more than half, as seen in Figure 6. Note that this is after taxes—that is, after a progressive tax system is supposed to have reduced inequality. With disposable income so concentrated in the top quintile, it is no wonder that, as Mark Zandi reports, the top 10 percent of households (by income) account for half of all consumption—a record going back to 1989 (Revell 2025).
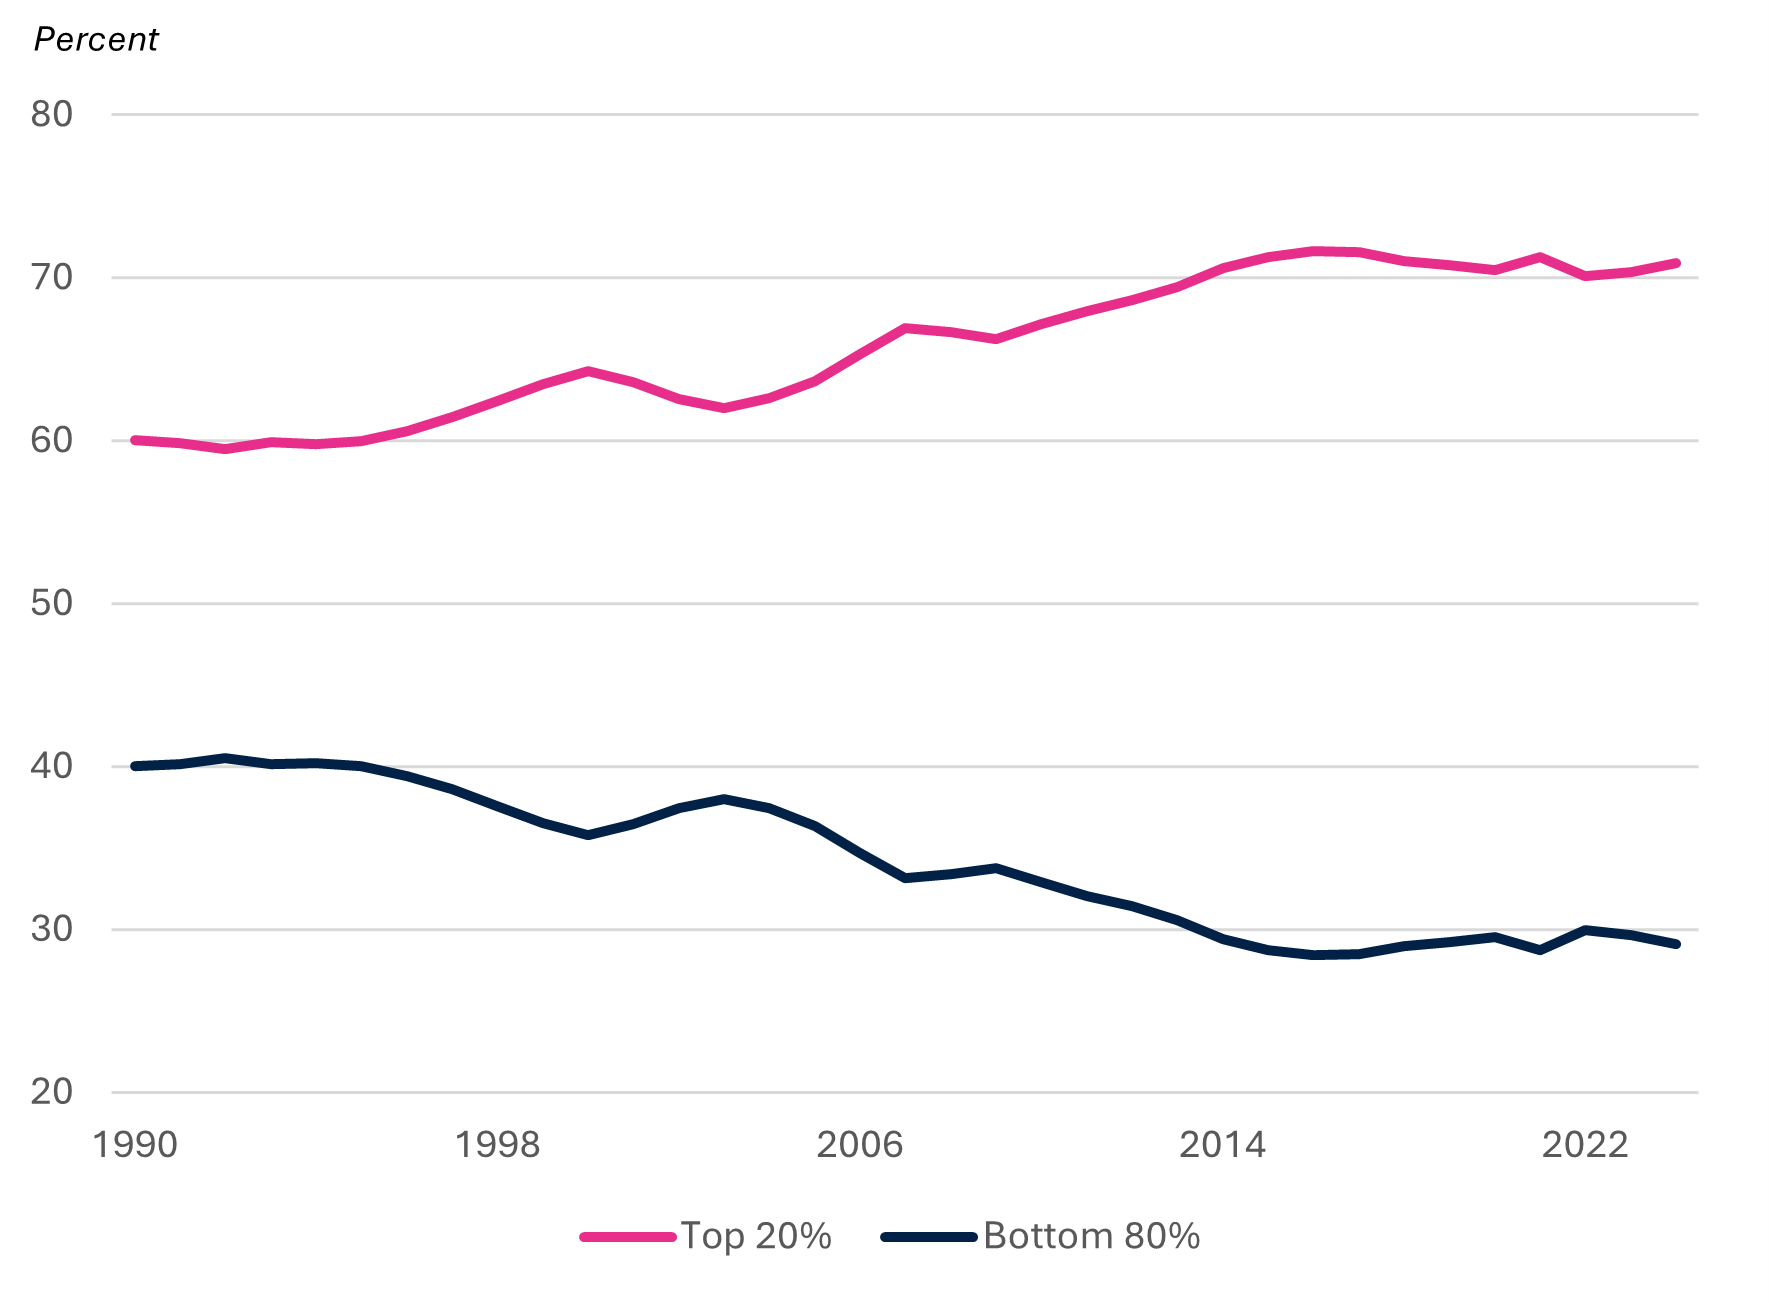
Wealth is distributed much more unequally, and the wealthy have increased their share, as Figure 7 shows.[9] The current bubble in stocks is minting more billionaires (the US gained 103 since 2024, bringing the global total to 3,028) (Contino 2025) and increasing what is already a record level of inequality (Rennison 2025). As Bernie Sanders (2024) put it, “[i]n this America, the three wealthiest men (Elon Musk, Jeff Bezos and Mark Zuckerberg) own more wealth than the bottom half of our society – over 165 million people… . The top 1 percent now own more wealth than the bottom 90 percent – and the gap between the very rich and everyone else is growing wider every day.”
While it would be overly simplistic to blame all of this on the Fed, its policy has played a role. High interest rates benefit wealth holders—those who earn interest income. Targeting inflation is also popular among wealth holders because low inflation protects the “real value” of their wealth. By contrast, inflation benefits debtors—those with mortgages, car loans, and student loans find it easier to make payments fixed in nominal terms. Fed policy that is biased against high employment depresses wage gains, contributing to the chronic wage stagnation that the US has experienced since the early 1970s (temporarily relieved during the COVID recovery). High interest rates discourage housing construction and contribute to the severe housing shortage we are facing today.
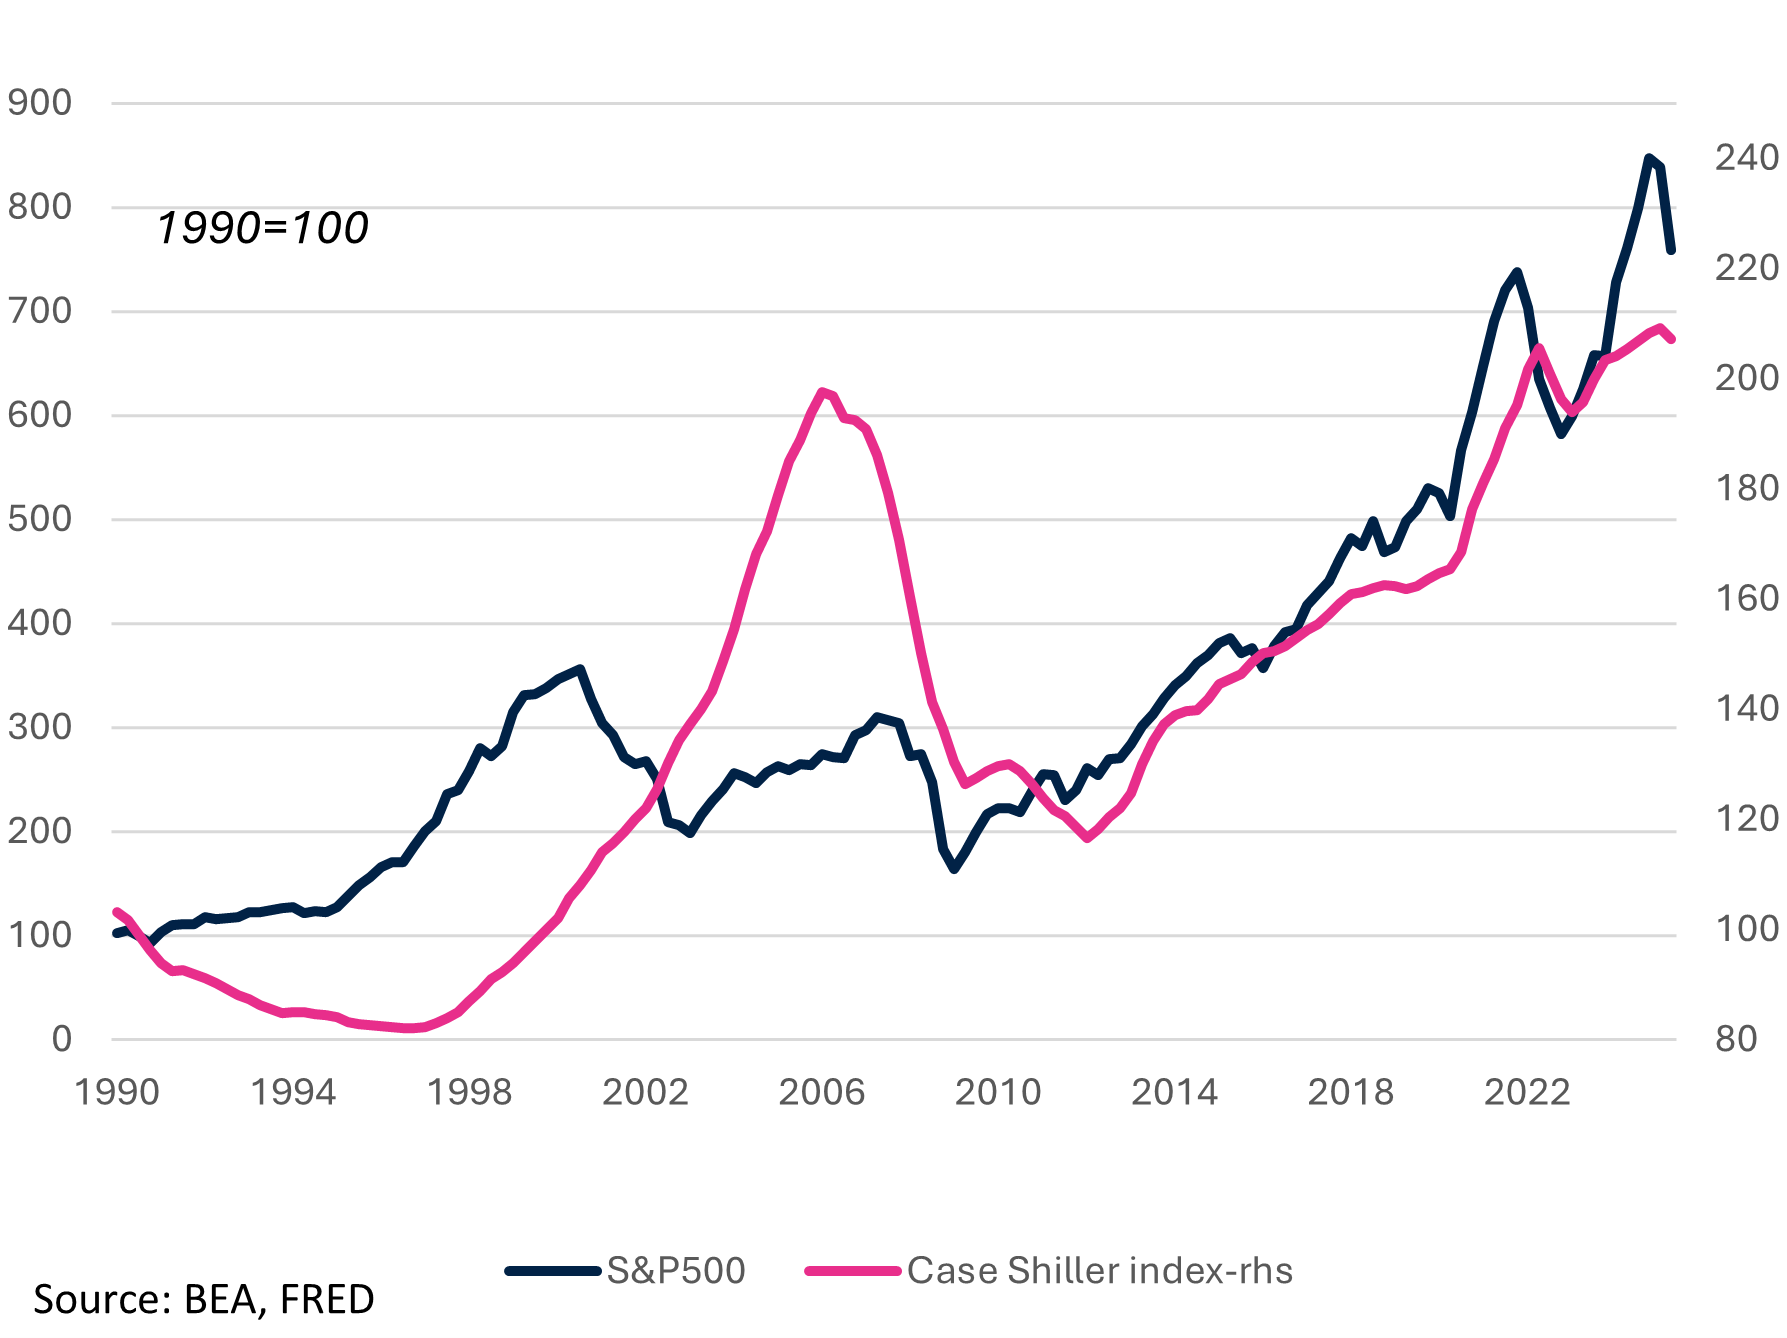
One final point must be made to reinforce the argument that our economy is on dangerous footing. Even as living standards stagnate or fall for the majority of Americans, those who depend on Wall Street have never had it so good. After the Dot.Com collapse and the stagnant stock market during the Global Financial Crisis, stocks have enjoyed a 15-year boom, seemingly impervious to real world events.[10] Today, the boom is driven by the “Magnificent Seven” technology stocks significantly linked to Artificial Intelligence, which are minting many of the new billionaires.
The financing of the firms behind this boom looks increasingly like the shaky financing of the bubbles in the housing, stock, and commodities markets in the mid-2000s. The crash of that bubble led to the Fed’s $29 trillion bailout of the global financial system (Wray 2013). Rather than reforming finance (as Roosevelt’s New Deal did in the 1930s), the Fed (with Congress and the president complicit) simply rebooted finance. In short, the Fed’s policy has helped “Wall Street” and hurt “Main Street”—whether intentionally or not. And that makes monetary policy as political as any government policy that comes out of Congress or the presidential administration.
Let’s repeat that: the decision to raise (or lower) interest rates is fundamentally a political decision. That does not make it wrong. The question is whether that political decision is best left to unelected appointees who clearly do not represent the population. The Board of Governors (and the district bank presidents who rotate onto the FOMC) is typically comprised of those who work in financial markets, in academia (mostly economics, finance, or business), and—more rarely—in the Fed, itself. Notably lacking are representatives who have a stake in jobs, good wages, and low interest rates: organized labor; social service organizations that deal with the consequences of stagnant wages, unemployment, and homelessness; and renters and homeowner groups.
Conclusions
What conclusions can we draw from all this?
- The Fed hikes rates as the economy peaks and unemployment reaches bottom;
- Fed rate hikes lead to softening in the labor market, suppressing employment and wage growth;
- The Fed then lowers rates as unemployment rises and the economy slows into recession;
- The Fed’s lip service to inflation is a diversion—it is not a good predictor of rate hikes (although the COVID inflation could be an exception);
- Fed policy contributes to rising inequality through several avenues;
- Greater inequality leads to slower growth of output and jobs; and
- Fed policy is not, and cannot be, free of politics as it creates winners and losers.
More relevant to our current situation, a prudent investor would presume based on the past 45 years that the Fed’s latest rate reduction is a good predictor of an oncoming recession. Indeed, as this policy note goes to press, the latest BLS data (released after the Fed’s meeting) showed growing job losses, rising unemployment and more involuntary part-time work—all of which presage a coming recession. Given the substantial evidence that the financial sector is in a bubble at least as big as that of the Dot.Com era, the recession could trigger a financial crisis.
Batten the hatches.
REFERENCES
Bivens, J. and B. Zipperer. 2018. “The importance of locking in full employment for the long haul.” Economic Policy Institute, Press Release, August 21, 2018.
Clarida, R. H. 2019. “The Federal Reserve’s Review of Its Monetary Policy Strategy, Tools, and Communication Practices.” Federal Reserve. Speech given at “A Hot Economy: Sustainability and Trade-Offs,” a Fed Listens event sponsored by the Federal Reserve Bank of San Francisco, San Francisco, California.
Contino, G. 2025. “Meet the newest members of the three-comma club.” Forbes, July 15, 2025.
Gratton, P. 2025. “Forget Sports Betting—Americans Found a New $300M Game: The Fed Meeting.” Investopedia, September 18, 2025.
Klein, M. C. 2025. “The Fed Submits?” The Overshoot, December 12, 2025.
Kurt, E. 2024. “Asymmetric Effects of Monetary Policy on Firms.” Washington Center for Equitable Growth Working Paper Series. https://equitablegrowth.org/wp-content/uploads/2024/09/091624-WP-Asymmetric-Effects-of-Monetary-Policy-on-Firms-Kurt.pdf
Smith, C. 2025. “The Fed Cut Rates Again but Deep Divisions Cloud Path Ahead.” The New York Times, December 10, 2025.
Nersisyan, Y. and L. R. Wray. 2022. “Is It Time for Rate Hikes?: The Fed Cannot Engineer a Soft Landing but Risks Stagflation by Trying.” Levy Economics Institute Public Policy Brief No. 157.
———. 2022. “What’s Causing Accelerating Inflation?: Pandemic or Policy Response?” Levy Economics Institute Working Paper No. 1003.
Papadimitriou, D. B., G. T. Yajima, and G. Zezza. 2025. “The US Economy amid Rising Global Uncertainty.” Levy Economics Institute Strategic Analysis October 2025.
Papadimitriou, D. B. and L. R. Wray. 1994. “Monetary Policy Uncovered Flying Blind: The Federal Reserve’s Experiment with Unobservables.” Levy Economics Institute Public Policy Brief No. 15.
———. 2021. “Still Flying Blind after All These Years: The Federal Reserve’s Continuing Experiments with Unobservables.” Levy Economics Institute Public Policy Brief No. 156.
Powell, J. 2019. Federal Reserve Chair Jerome Powell Testifies on the State of the Economy. C-SPAN video. July 10, 2019.
Sanders, B. 2024. Two Americas, the people vs. the billionaires. Statement on Fox News, December 27, 2024.
Rennison, J. 2025. “Wall Street Is Shaking Off Fears of an A.I. Bubble. For Now.” The New York Times, December 9, 2025.
Revell, E. 2025. “America’s wealthiest households driving nearly half of consumer spending: Moody’s.” FOXBusiness, February 25, 2025.
Rudd, J. B. 2021. “Why Do We Think That Inflation Expectations Matter for Inflation? And Should We?” Finance and Economics Discussion Series 2021-062. Washington, DC: Board of Governors of the Federal Reserve System.
Ruggeri, F., R. Pariboni, and G. T. Yajima. 2025. “A Stock-Flow Consistent Model of Emulation, Debt, and Personal Income Inequality.” Levy Economics Institute Working Paper No. 1099.
Tarullo, D. K. 2017. “Monetary Policy without a Working Theory of Inflation.” Hutchins Center Working Paper No. 33. Washington, DC: The Brookings Institution. October
Williams, J. C. 2019. “Discussion of ‘Prospects for Inflation in a High Pressure Economy: Is the Phillips Curve Dead or Is It Just Hibernating?’ by Peter Hooper, Frederic S. Mishkin, and Amir Sufi.” Federal Reserve Bank of New York. Speech given at the U.S. Monetary Policy Forum, New York City.
Wray, L. R. 2013. “The Lender of Last Resort: A Critical Analysis of the Federal Reserve’s Unprecedented Intervention after 2007.” Levy Economics Institute Research Project Report April 2013.
FOOTNOTES
[2] “What economic goals does the Federal Reserve seek to achieve through its monetary policy?”
[3] The Fed has adopted a “corridor” system paying interest on reserves (setting a floor on the fed funds rate) and charging a penalty rate on discount window loans (setting a ceiling). Thus, the fed funds rate can fluctuate somewhat above or below the target.
[4] The FOMC normally meets eight times a year but can hold additional meetings when it believes they are necessary.
[5] See Nersisyan and Wray (2022); Papadimitriou and Wray (2021; 1994).
[6] See Rudd (2021); Tarullo (2017).
[7] Treasury Secretary Bessent recently blasted Fed economists: “The Fed is turning into universal basic income for PhD economists. I don’t know what they do. They’re never right … If air traffic controllers did this, no one would get in an airplane.”
[8] See Papadimitriou, Yajima, and Zezza (2025) for source and discussion of this graph.
[9] For source and discussion see Ruggeri, Pariboni, and Yajima (2025).
[10] For source and discussion see Papadimitriou, Yajima, and Zezza (2025).