How Secure Is Wage Employment in Sub-Saharan Africa?
Employment security refers to the ability of both formal and informal institutions to provide employed individuals protection against economic risks and support their economic progress. It is related, but not limited, to the worker’s capacity to earn a sufficient level of income. In most high-income countries, government-supported or government-facilitated institutions exist, with varying degrees of effectiveness, to safeguard against risks such as old age, sickness, disability, and short-term unemployment. In low- and middle-income countries, where welfare state institutions are weak or absent, the situation is quite different. At least some protections, however limited, are primarily available to a relatively small segment of the population—specifically, employees in formal jobs with relatively high pay. In societies with weak welfare systems that do not offer adequate financial protection, most workers depend solely on income and nonwage benefits from employment for their economic security, therefore placing them at various levels of precarity depending on their employment type (whether formal or informal), individual earnings, family income, background, and other factors.
Since the early 2000s, research and policy on employment quality have advanced through initiatives such as the International Labour Organization’s (ILO) Decent Work Indicators, which monitor employment creation, social protection, rights at work, and social dialogue. The United Nations (UN) incorporated these goals into the 2030 Agenda for Sustainable Development, promoting inclusive economic growth and decent work. Additionally, efforts include employment quality indicators developed by the Organisation for Economic Co-operation and Development and the UN Economic Commission for Europe (UNECE) (Cazes et al. 2015; UNECE 2015), and more recently, the World Bank’s job quality index for several developing countries (Hovhannisyan et al. 2022). Building on this body of work, we develop an employment insecurity index (EII) that combines two dimensions of wage employment: (1) access to nonwage benefits and (2) desirable features of the employment relationship, with a focus on gender disparities among employees. Our study compares two sub-Saharan African countries: Ghana and South Africa. Ghana’s per capita GDP is only about half that of South Africa, after accounting for national differences in price levels (World Bank 2024). Additionally, the proportion of wage employment among employed individuals is about twice as high in South Africa as it is in Ghana. Given these substantial differences, it is worth exploring whether employment security increases with economic development or the prevalence of wage employment.
The index construction is guided by the analytical framework of the UN’s Multidimensional Poverty Index (UNDP 2024). The EII is calculated from the insecurity score of individual employees, which ranges from zero to one—zero indicating no insecurity and one representing the highest level of insecurity. We assign equal weight (one-half) to the two dimensions of employment security associated with wage employment. In the first dimension, encompassing nonwage benefits, we include pension coverage, medical benefits, paid holidays, paid sick leave, and natal benefits, each having a weight of one-tenth (0.5/5). In South Africa, natal benefits cover both paternity and maternity leave, whereas in Ghana, they only include maternity leave. The second dimension relates to favorable employment characteristics, namely, a written contract, permanent job tenure, and unionization. Each component within a dimension shares the same weight of one-sixth (0.5/3). Each nonwage benefit indicator is set to one if the benefit is lacking and to zero if the benefit is present. Similarly, each indicator of employment relationship is scored one if the feature is absent from the employment and 0 if it is included.
Using nationally representative samples of employees, we calculate the insecurity score for each employee aged 15 and over. We consider an employee insecure if they are deficient in at least one of the dimensions. That is, we treat people with values equal to or greater than 0.5 as insecure. We also identify thresholds for various degrees of insecurity, from none to severe. If a person lacks only a nonwage benefit and a desirable employment relation, their insecurity score would be about 0.27. We consider those with scores below this threshold as not insecure in their employment. We refer to those with scores equal to or above the secure threshold (0.27) and below the insecure threshold (0.5) as vulnerable to employment insecurity. To characterize moderate and severe insecurity, we consider an employee with only one nonwage benefit and one desirable employment relation. Such a person would have a score around 0.73. We classify those with scores equal to or above 0.5 but less than 0.73 as facing moderate insecurity. Finally, individuals with scores equal to or above 0.73 are regarded as facing severe insecurity.1
To construct the EII, we calculate two summary statistics. The first is the headcount ratio—that is, the proportion of insecure employees of the total number of employees. In addition, we compute an indicator that reflects the intensity of insecurity. This is simply the average insecurity score among insecure employees. The EII is the product of the headcount ratio and the intensity of insecurity (Table 1).2
Table 1 Employment Insecurity Index (EII) and Its Components by Country and Gender
| Men | Women | All | |
| EII (value) | |||
| Ghana | 0.491 | 0.470 | 0.484 |
| South Africa | 0.322 | 0.349 | 0.334 |
| Headcount ratio (percent) | |||
| Ghana | 62 | 59 | 61 |
| South Africa | 39 | 43 | 41 |
| Intensity of insecurity (percent) | |||
| Ghana | 80 | 80 | 80 |
| South Africa | 82 | 81 | 82 |
Source: Authors’ calculations based on pooling data from 2013, 2017, and 2022 for each country
People in Ghana are nearly 5 times worse off than their South African counterparts in multidimensional poverty, according to the latest UN report (UNDP 2024). The multidimensional poverty index (MPI) used in the report considers multiple indicators of deprivation, including access to water and sanitation, as well as monetary indicators such as income. The estimated values of the EII in South Africa and Ghana are 0.334 and 0.484, respectively, indicating that workers in Ghana face 1.4 times more employment insecurity than those in South Africa. Although the gap is significant, it is much smaller than the difference in multidimensional poverty. Of the two factors influencing the EII, the disparity in the headcount ratio is far more influential than differences in insecurity intensity in explaining Ghana’s higher index value. Approximately 6 out of 10 wage workers in Ghana experience employment insecurity, compared to 4 out of 10 in South Africa. However, both countries are similar in insecurity intensity, with scores of 80 in Ghana and 82 in South Africa. On average, individuals with insecure jobs in both countries are deprived of about 80 percent of the indicators included in the EII. Since the index includes eight indicators, this suggests that employees with insecure employment have access to only one nonwage benefit or one favorable employment relation. Our results show no economically significant disparities between male and female employees.
What Drives Employment Insecurity in These Two Countries?
The types of insecurity faced by those experiencing employment insecurity require attention. Consider nonwage benefits. In both countries, the absence of pension and medical coverage is nearly universal among insecure employees (Table 2).
Table 2 Percent of Employees with Insecure Employment Lacking Nonwage Benefits and Favorable Employment Relations by Type of Benefit, Relation, and Gender
| Nonwage benefits | Employment relation | |||||||
| Pension | Medical | Holiday | Sick leave | Natal leave | Written contract | Permanent job | Union | |
| Ghana | ||||||||
| Total | 95 | 96 | 91 | 89 | 87 | 27 | 86 | |
| Men | 95 | 96 | 93 | 90 | 87 | 25 | 84 | |
| Women | 95 | 95 | 88 | 87 | 91 | 85 | 30 | 90 |
| South Africa | ||||||||
| Total | 97 | 99 | 78 | 70 | 89 | 46 | 86 | 97 |
| Men | 97 | 99 | 79 | 71 | 91 | 48 | 86 | 96 |
| Women | 98 | 99 | 77 | 70 | 87 | 44 | 86 | 97 |
Source: Authors’ calculation based on pooling data from 2013, 2017, and 2022 for each country
Regarding pensions, the legal requirement for mandatory coverage has not helped those experiencing employment insecurity (about 60 percent of all Ghanaian employees). Somewhat lower levels are observed for the lack of holiday and sick leave benefits. For these two benefits, the deficiency in South Africa is notably less than in Ghana, especially for sick leave. As noted earlier, there is no mandated paternity leave in Ghana, whereas in South Africa, such a provision exists. Comparing women with insecure employment in the two countries showed that, even with mandatory provisions, nearly 90 percent do not report any entitlement to maternity leave. Among the employment insecure, with the exception of pensions, the percentage of women in both countries who are lacking in nonwage benefits tends to be lower than that of men.
Turning to the set of employment relations, we find that persons with insecure employment face less union protection in South Africa than do those in Ghana. This probably reflects the higher unionization rates in Ghana. The prevalence of permanent jobs and written contracts demonstrates a clear contrast between the countries. Most Ghanaians do not have a written contract and believe their jobs are permanent. In South Africa, the majority have a written contract, perhaps indicating widespread compliance with legal requirements, but most do not have a permanent job. Since the overwhelming share of Ghanaians do not have a written contract, their presumption of a permanent job is based on individual perception or oral contracts, which are recognized under Ghana’s labor laws. In contrast, those without a permanent job in South Africa may, in most instances, describe the terms of their written contract. Therefore, it is reasonable to think that some part of the EII in Ghana is influenced by unobservable factors related to individual perception and oral contracts, which in turn affect cross-country comparisons. While employment insecure women in Ghana are more likely than men not to have permanent jobs or be union members, in South Africa, it is only with respect to having a written contract that gender differences emerge in employment.
Degree of Employment Insecurity
Figure 1: Distribution of Employees by Country, Gender, and Degree of Employment Insecurity (percent)
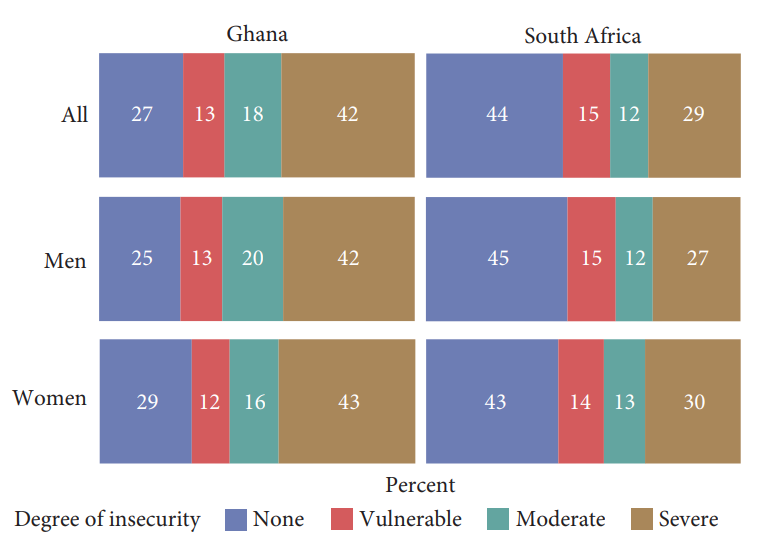
Source: Authors’ calculation based on pooling data from 2013, 2017, and 2022 for each country
We find that most (around 70 percent) of those experiencing employment insecurity suffer from a severe degree of insecurity, meaning they do not have even one nonwage benefit or one favorable employment relation (Figure 1). Only a minority of insecure individuals face a moderate degree of insecurity. Similarly, among those below the insecurity threshold, workers with some vulnerability in employment security constitute a smaller share compared to those without any insecurity. Thus, there is a stark polarization in the distribution of employment insecurity, as the largest shares of employees fall into either the severe insecurity or the no insecurity categories. In both countries, the proportion of employees in the intermediate ranges of the insecurity score (vulnerable or moderate insecurity) is notably smaller than that of those with severe or no insecurity. The degree and direction of polarization vary between the two countries. In Ghana, the largest share of employees is found in jobs with severe insecurity (42 percent), whereas in South Africa, the largest share (44 percent) has no insecurity. However, it should be noted that even in South Africa, the majority of employees are still vulnerable to insecurity or are insecure. The pattern of the degree of employment insecurity is almost identical between women and men in both countries.
Why does such a large share of employees lack nonwage benefits? The reasons are complex and varied between countries. One factor is whether certain benefits are mandatory. The only benefits that are mandatory in both countries are paid holidays and parental leave. Pension coverage through the National Social Security scheme is mandatory in Ghana, but such a system does not exist in South Africa. Conversely, paid sick leave is mandatory in South Africa but not in Ghana. Medical benefits are not mandatory in either country. Another factor is compliance with existing mandates. We would expect compliance to be higher in the formal sector than in the informal sector. This is indeed the case in South Africa. However, the evidence suggests that employment in the formal sector does not always protect against employment insecurity. About 82 percent of employees work in the formal sector, which accounts for 61 percent of employees with insecure employment in South Africa.
Finally, we examine the relationship between wage distribution and the degree of employment insecurity. We find that a clear negative relationship emerges in both countries: as employment insecurity intensifies from “None” to “Severe,” the share of employees in higher wage quintiles decreases while the share in lower quintiles increases (Figure 2).
Figure 2: Share of Employees Belonging to Various Quintiles of the Wage Distribution in Each Level of Employment Insecurity, by Country and Gender
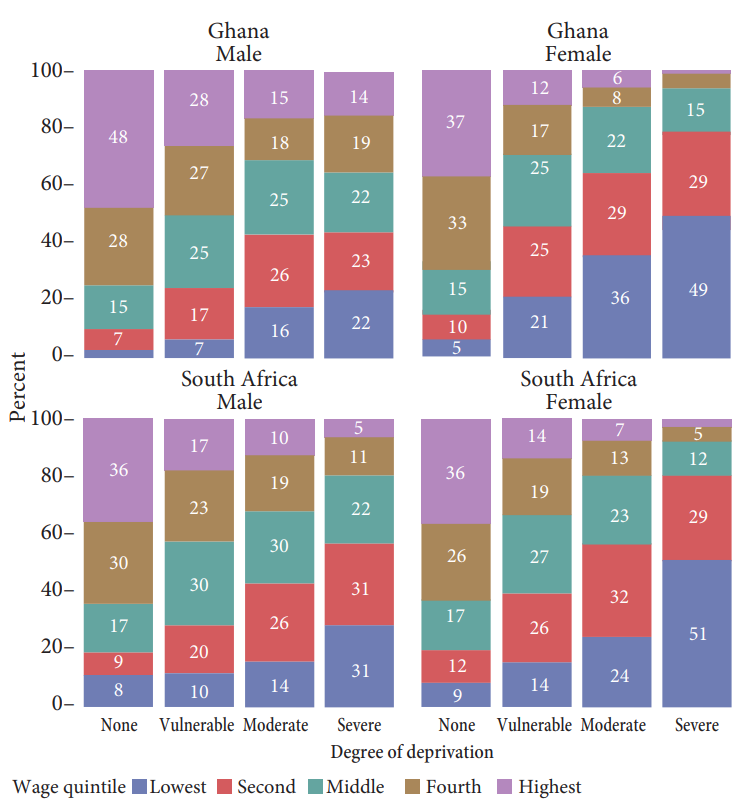
Source: Authors’ calculation based on pooling data from 2013, 2017, and 2022 for each country. Note that segments with no numbers shown have very small shares (less than four percent) in that category.
Gender disparities are evident in both countries, although to varying degrees. In Ghana, there is a markedly higher share of top earners (top 20 percent) among male employees with “None” employment insecurity than female employees with the same level of employment security. We find that the share of top earners with “None” employment insecurity is identical for men and women in South Africa. In contrast, the share of low earners (bottom 20 percent) among male employees with severe insecurity is notably lower than that among female employees with severe insecurity in both countries. The middle quintiles show more gradual transitions. As employment insecurity increases, the decline in the share of employees in the highest wage quintile is markedly steeper for women than for men; the share of women in the high wage quintile in Ghana literally disappears as employment insecurity turns severe. The results highlight a double jeopardy for women: not only are they overrepresented in lower wage quintiles, but their concentration in those quintiles makes them vulnerable to employment insecurity—an effect slightly more pronounced in Ghana than in South Africa.
Conclusion
For employees lacking basic nonwage benefits such as paid holidays, paid sick leave, or maternity leave, life can involve tough choices, including going to work sick and forgoing income to recover from illness or childbirth. The absence of employer-provided medical coverage is not necessarily problematic if publicly available healthcare of reasonable quality exists for everyone at little to no cost. However, this is rarely the case in either country. In Ghana, about two-thirds of all employees reported having some form of coverage in 2022; still, nearly 90 percent of these individuals said that most of their healthcare expenses are usually paid out-of-pocket by themselves or their families, with only 7 percent citing the National Health Insurance Scheme as their main payer. Unlike Ghana, South Africa does not have a mandatory public health insurance system. Only 30 percent of employees have coverage, according to the latest available data (2022). The country’s healthcare system is split, with a poorly funded public system that mainly serves the majority and a relatively well-funded private system that caters to better-paid formal sector workers and other high-income groups. In both countries, many employees shoulder the physical, mental, and financial burdens of being unable to meet basic self-care needs while maintaining their income. Moreover, employees lacking favorable employment relations face greater disadvantages, limiting their ability to negotiate for better wages and nonwage benefits.
Overall, the EII highlights the widespread prevalence of employment insecurity in Ghana and South Africa, in terms of lack of nonwage benefits or favorable employment relations. While the degree of insecurity along with gender disparities varies in the two countries, the findings point to the need for advancing inclusive social protection as a mandatory provision, alongside strong regulations to ensure universal compliance in both countries. This, combined with strengthening employees’ voice through measures such as unionization and written contracts, is essential for fostering employment security and enabling workers to withstand economic risks without compromising their economic progress and well-being. Moreover, the inverse relationship between employment insecurity and wages reinforces the need for integrated, gender-responsive labor market policies that address both wage and nonwage dimensions of employment security and job quality.
The research reported here was conducted as part of the project “A program to generate new knowledge and share knowledge about economic empowerment of women, especially in sub-Saharan Africa,” with generous funding from the Hewlett Foundation. This publication draws heavily from the forthcoming Levy Institute research project report, “Nonwage Benefits and Employment Security in Ghana and South Africa.”
Written with the assistance of Brandon Istenes.
Notes
- The cutoff values will be different for men in Ghana because there are potentially only four, instead of five, nonwage benefits available to them. Hence, the weight of each nonwage benefit in the score will be 0.5/4 ≈ 0.125. Therefore, the cutoff for no insecurity is 0.29 and the threshold for severe insecurity is 0.71.
- The primary sources of information for Ghana are the 2012–13 and 2016–17 rounds of the Ghana Living Standards Survey (GLSS), as well as the 2022 round of the Annual Household Income and Expenditure Survey (AHIES) (Ghana Statistical Service (GSS) 2012; 2017; 2023). For South Africa, we rely on the 2013, 2017, and 2022 rounds of the Labour Market Dynamics (LMD) data files, which are compiled from the Quarterly Labour Force Surveys (QLFS), particularly the data assembled in the PALMS database from the QLFS (Statistics South Africa 2013; 2017; 2022; Kerr, Lam, and Wittenber 2019).
References
Cazes, S., A. Hijzen, and A. Saint-Martin. 2015. “Measuring and Assessing Job Quality: The OECD Job Quality Framework” OECD Social, Employment and Migration Working Papers, No. 174.
Ghana Statistical Service (GSS). 2012. Ghana Living Standards Survey (GLSS6) 2012, version1.0. Retrieved from
———. 2017. Ghana Living Standards Survey Round 7 (GLSS 7) 2017, Microdata [Data set]. Accra, Ghana: Ghana Statistical Service. Retrieved from
———. 2023. Annual Household Income and Expenditure Survey (AHIES) 2023, Microdata [Data set]. Accra, Ghana: Ghana Statistical Service.
Hovhannisyan, S., V. Montalva-Talledo, T. Remick, C. Rodriguez-Castelán, and K. Stamm. 2022. “Global Job Quality: Evidence from Wage Employment across Developing Countries.” World Bank, Working Paper no. WPS 10134, Policy Research.
Statistics South Africa. Data from Labour Market Dynamics in South Africa 2013. Version 1. Pretoria: Statistics South Africa [producer], 2014. Cape Town: DataFirst [distributor], 2015.
———. Data from Labour Market Dynamics in South Africa 2017. Version 1. Pretoria: Statistics South Africa [producer], 2018. Cape Town: DataFirst [distributor], 2019. DOI: https://doi.org/10.25828/wyv8-6k31
———. Data from Labour Market Dynamics in South Africa 2022. Version 1. Pretoria: Statistics South Africa [producer], 2022. Cape Town: DataFirst [distributor], 2024.
World Bank. 2024. Data from the International Comparison Program (ICP). Retrieved [September 10, 2025].
UNDP (United Nations Development Program). 2024. 2024 Global Multidimensional Poverty Index (MPI), in Human Development Reports. United Nations.
UN Economic Commission for Europe. 2015. Handbook on Measuring Quality of Employment: A Statistical Framework, prepared by the Expert Group on Measuring Quality of Employment. United Nations.